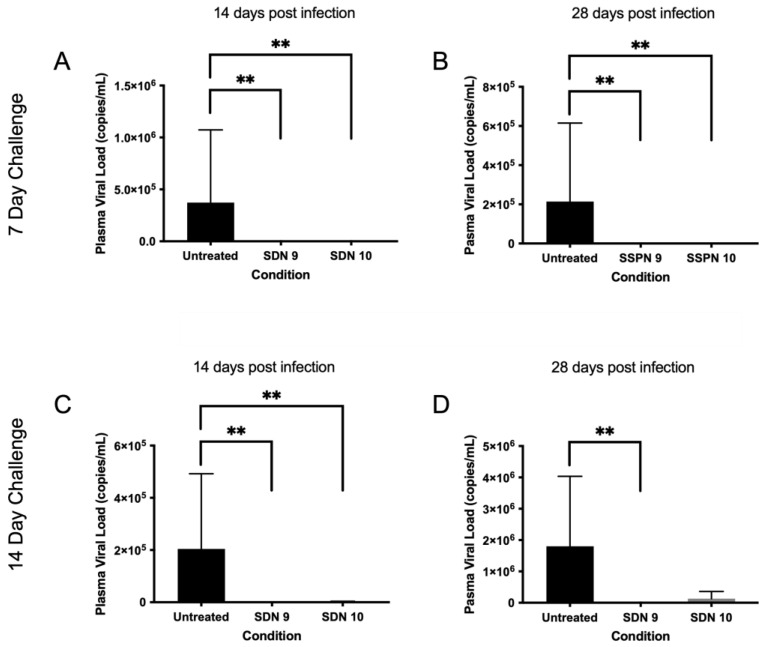
Figure 4.
Plasma viral load following HIV challenge 7 (A,B) and 14 days (C,D) post-injection. Subfigures show viral load (copies/mL) at 14- and 28-days post-infection IM injection (700 copies/mL detection limit). ** denotes p value > 0.01 determined using significance using a one-sided, pairwise Mann–Whitney–Wilcoxon test, with Bonferroni correction factor.

