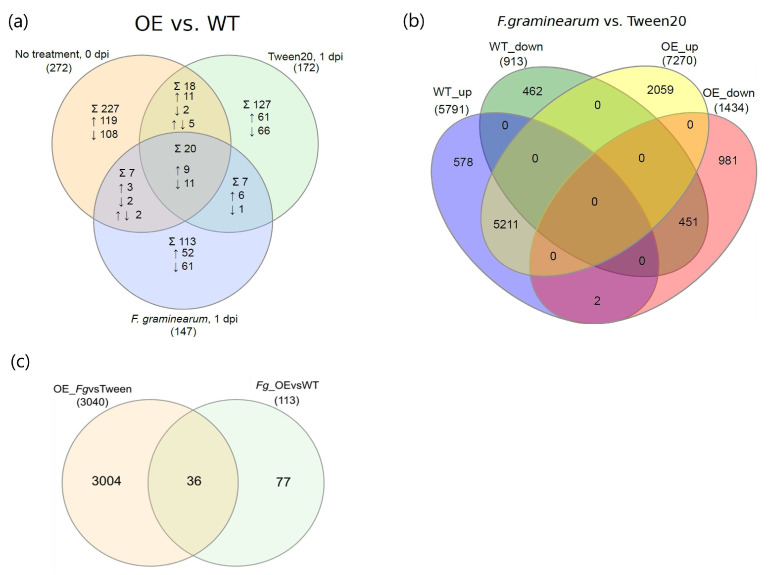
Figure 2.
Venn diagrams illustrating the impact of TaNACL-D1 overexpression and F. graminearum inoculation on the wheat transcriptome: (a) TaNACL-D1-regulated transcript numbers (differentially expressed between the overexpressor (OE) and the wild type (WT) in either non-treated plants (day zero), Tween20-treated plants (mock) at one-day post-inoculation (dpi), or F. graminearum-treated plants at 1 dpi; (b) F. graminearum (Fg)-regulated transcripts (differentially expressed between Fg and mock treatment) in the WT and OE at 1 dpi; and (c) Venn diagram illustrating that 36 transcripts were both responsive to F. graminearum in the OE (and not in the WT) and significantly more- or less-expressed (higher or lower transcript levels) in the pathogen-treated OE versus WT spikelets (at 1 dpi). In each Venn diagram, the numbers in brackets indicate the total number of transcripts in each comparison group, the numbers in the overlapping areas indicate those being shared between two or more comparison groups, and the numbers in the areas not being shared by any of the comparison groups indicate those transcripts specific to the group. Symbols and abbreviations: ↑ Upregulated (up); ↓ Downregulated (down); ↑↓ Up- and downregulated; ∑ total number of TaNACL-D1-regulated transcripts.

