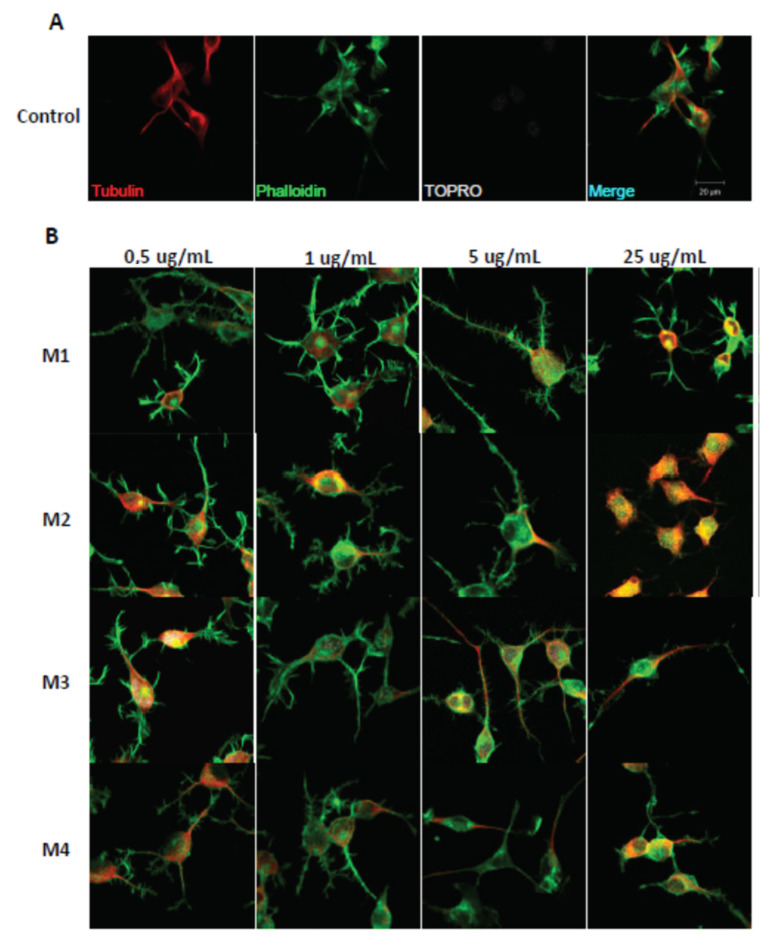
Figure 3.
Immunohistochemical staining of N2a cells treated with M1, M2, M3, and M4 fractions for 24 h. Immunofluorescence assays representing the control condition (A). Protein markers used in the experiment are shown as follows: α-Tubulin: microtubule-associated protein marker; Phalloidin: β-actin protein marker; Topro: cell core, and merge of all the channels involved. (B) Representative images of N2a cells treated with 0.5 μg/mL, 1.0 μg/mL, 5.0 μg/mL, and 25.0 μg/mL of AnSh fractions.

