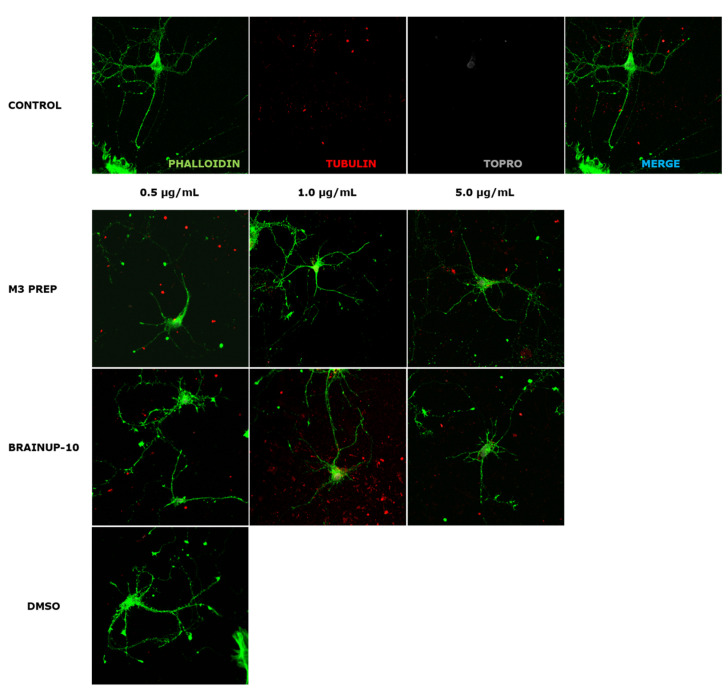
Figure 8.
Representative morphology images of RHN cells after treatment with different concentrations of the Precipitate M3 subfraction or BrainUp-10®. Immunofluorescence assays represent different assay conditions. Control condition. Protein markers used in the experiment are shown as follows: Phalloidin: β-actin protein marker; α-Tubulin: microtubule-associated protein marker; Topro: cell core and merge of all the channels involved. The representative images of RHN present morphological changes after being treated with 0.5 μg/and mL; 1.0 μg/mL, 5.0 μg/mL of the Precipitate M3 subfraction or BrainUp-10® for 24 h. DMSO is shown as the vehicle solution control.

