Figure 1.
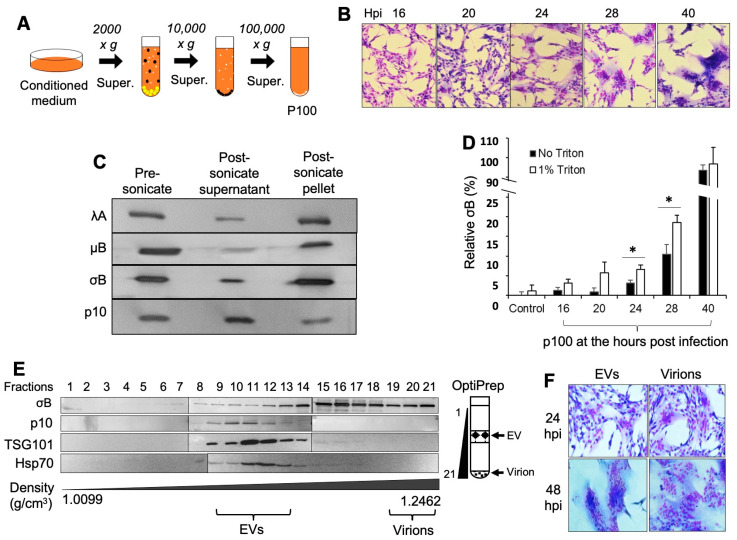
ARV-infected cells release virus proteins in EVs and the EV fractions are infectious. (A) The conditioned culture medium was collected by differential centrifugation to obtain the p100 pellet. (B) The QM5 cells were infected with ARV and Giemsa-stained at the indicated time points. The culture medium was collected at the same time points to harvest p100 as per the method indicated in Section 2.3. (C) The 24 h p100 sample was treated with 1% Triton and sonication, then re-pelleted by 100,000× g (the method in Section 2.5). ARV proteins in the supernatant and pellets were analyzed by immunoblotting with the chicken antibody against ARV virions (only λA blots displayed) and rabbit antibodies against μB, σB, or FAST protein p10. Representative images from one of two experiments are shown. (D) The p100s were treated with or without 1% Triton and the outer capsid protein σB was measured by sandwich ELISA. The OD450 absorbance data for the 40 h sample with Triton were set as 100%, and the control sample without Triton was set as 0% to calculate the relative amount of outer capsid protein σB for the rest of the samples. The conditioned culture mediums collected from the uninfected cells were treated with the same methods and used as the control samples. Results are the mean and standard deviation from n = 2 independent experiments. Student’s t-test was used for statistical analysis, * represents p < 0.05. (E) The p100 fraction collected at 24-h post-infection was further fractionated on OptiPrep gradients to separate denser virus particles from EVs, and gradient fractions (1–21, top-bottom, as shown in right cartoon) were analyzed on Western blots probed with antibodies against the major outer capsid protein (σB), FAST protein (p10), or exosome markers (TSG101, Hsp70). Fractions corresponding to EVs and virus particles are labeled in the image. (F) Quail cells were treated with equal volumes of the EVs (fractions 9–14) or virions (fractions 19–21) from OptiPrep performed on p100 obtained from conditioned media of 24 h post-infected cells. Cells were Giemsa-stained at 24 h or 48 h post treatment and imaged by light microscopy at 200× magnification. Representative images from one of two experiments are shown in panel 1 (F).

