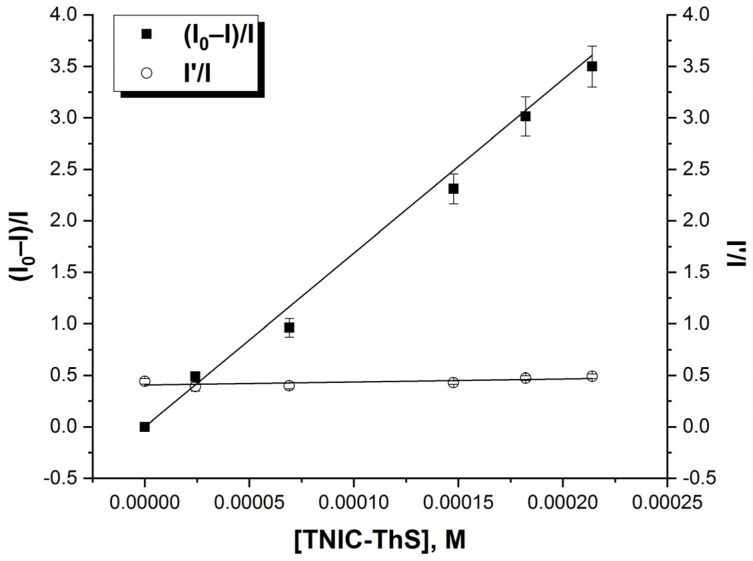
Figure 2.
The Stern–Volmer graph for the fluorescence quenching of pyrene as a function of TNIC-ThS concentration and the fluorescence intensity ratio of excimer (I′) over monomer (I) as a function of TNIC-ThS concentration. Liposomes suspension (0.5 mM PC) containing 5.0 μM of pyrene was titrated by consecutive additions of TNIC-ThS solution (1 mM). The excitation and emission slits were adjusted at 5 nm, and the excitation wavelength was 337 nm.

