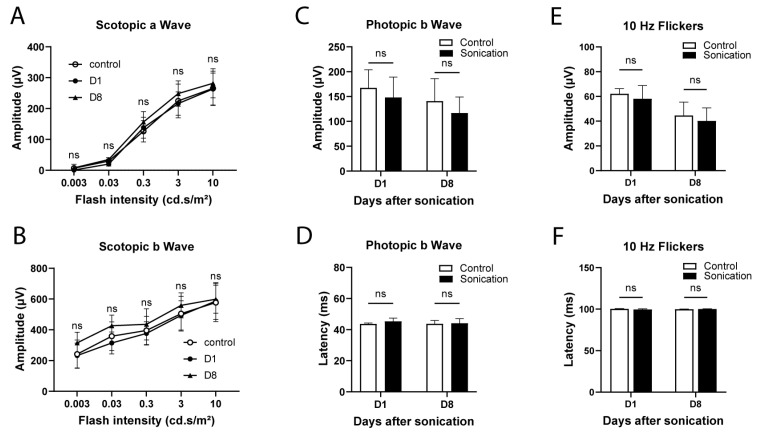
Figure 4.
Electroretinography at Day (D)1 and 8 of sonication in the sonicated (0.15 MPa) and control (contralateral) eyes. (A) Scotopic a-wave amplitude. (B) Scotopic b-wave amplitude. Photopic b-wave amplitude (C) and latency (D). The 10 Hz flicker amplitude (E) and latency (F). (n = 3–8/group), two-way ANOVA (A,B) or Mann–Whitney (C–F) comparison versus the controls, ns: not statistically significant.

