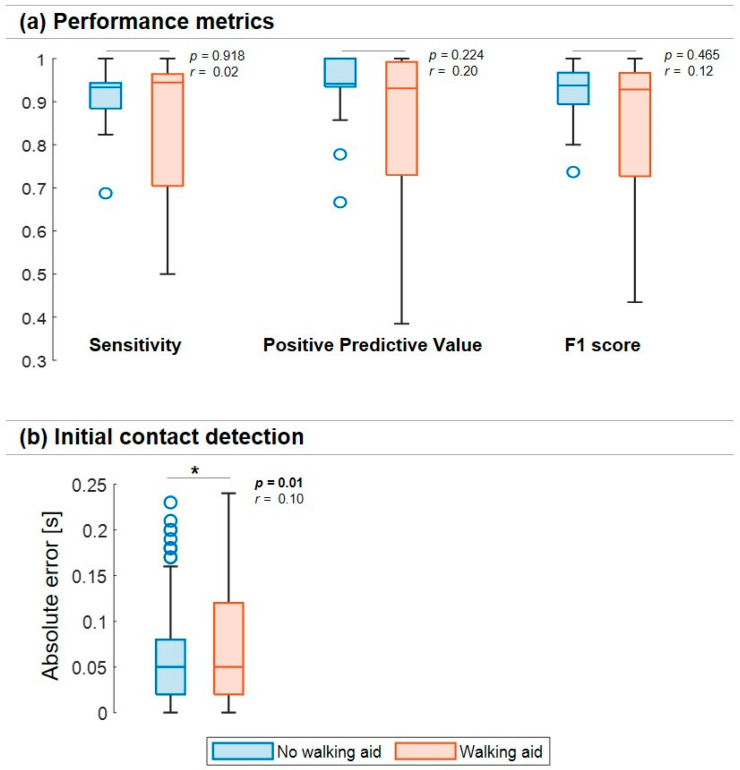
Figure 3.
Comparison of patients with and without a walking aid for (a) different performance metrics (sensitivity, positive predictive value, and F1 score) and (b) absolute errors [s] in the initial contact detection. * shows a significant p-value. Boxplots (minimum, lower quartile, median, upper quartile, and maximum) are used to display values obtained from the different walking tests. Outliers are also shown.

