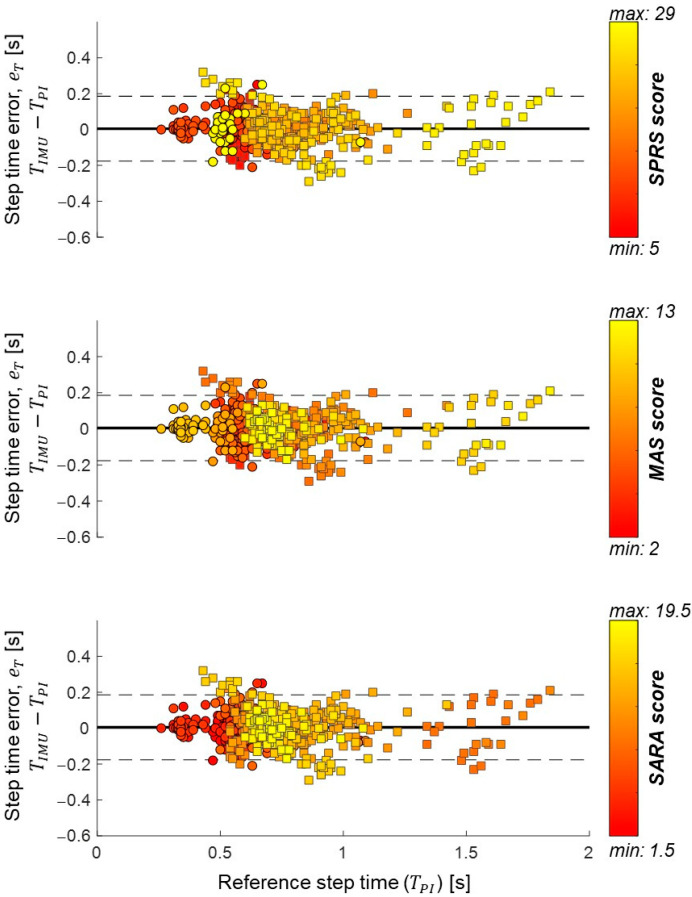
Figure 4.
Bland–Altman plots for step time error values () calculated between IMU-based and reference step durations. Errors are assessed for each detected step (n = 596) and patients. Bias (continuous lines) and limit of agreements (dashed lines) are also shown. Values identified for steps performed by patients using walking aids are shown with squares; circles are used otherwise. The different colours indicate the disability severity based on the three clinical scales (colour-coded based on the relevant bar shown on the right): Spastic Paraplegia Rating Scale (SPRS), upper panel; Modified Ashworth Scale (MAS), middle panel; Scale for the Assessment and Rating of Ataxia (SARA), lower panel.

