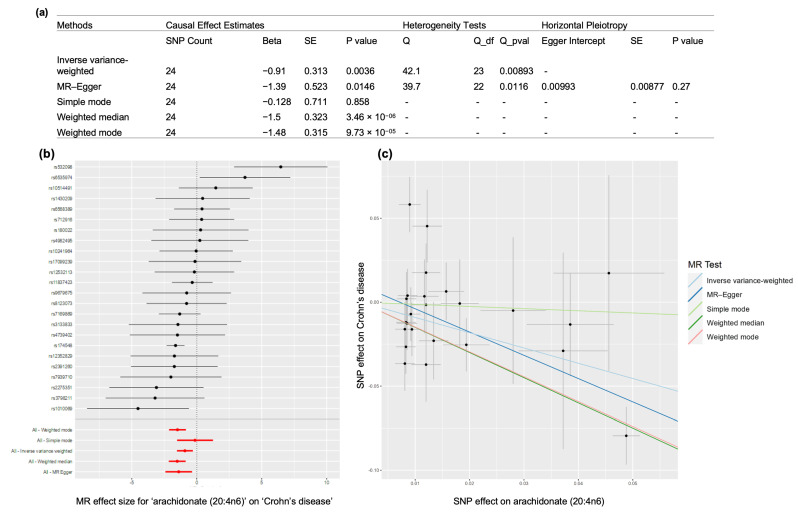
Figure 2.
Assessment of causal effects of arachidonic acid levels on Crohn’s disease. (a) A summary table displaying the results of MR analysis, heterogeneity and horizontal pleiotropy tests; (b) a forest plot comparing the causal effects calculated using the methods including all the SNPs (illustrated by red color) to using each SNP separately (illustrated by black color). (c) a scatter plot showing the relationships between SNP effects on arachidonic acids against the SNP effects on Crohn’s disease, with slope indicating the causal association.

