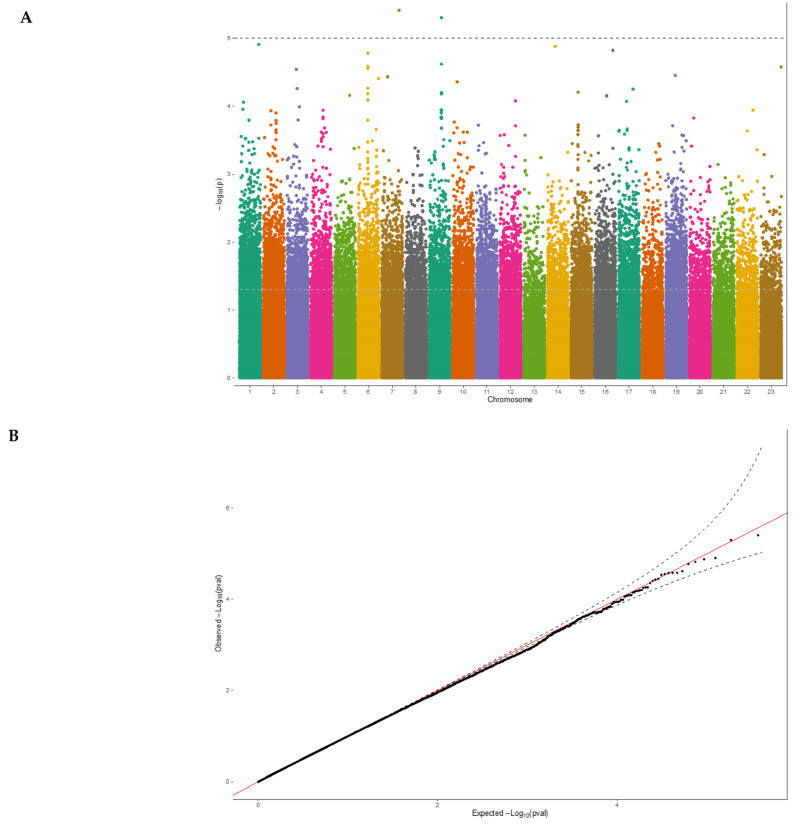
Figure 1.
Manhattan plot and Q-Q plot of the ExWAS results for 25(OH)D levels. (A) Manhattan plot displays chromosomal positions of genetic variants (x-axis), and the –log10 p-value (y-axis) with a horizontal grey line represents the top signals of p-value < 1 × 10⁻⁵. The plot shows novel genomic regions on chromosome 7 and 9 that exceed the significance threshold of vitamin D ExWAS (n = 481,395 variants). (B) Q-Q plot displays a good fit between the observed –log10 p-values (y-axis) with expected –log10 p-values (x-axis), indicating that the ExWAS results are not biased and are consistent with the null hypothesis. The red line depicts the expected distribution of the p-values, while the black line represents the observed distribution. The black dashed lines represent the lower and upper limits of the 95% confidence interval.

