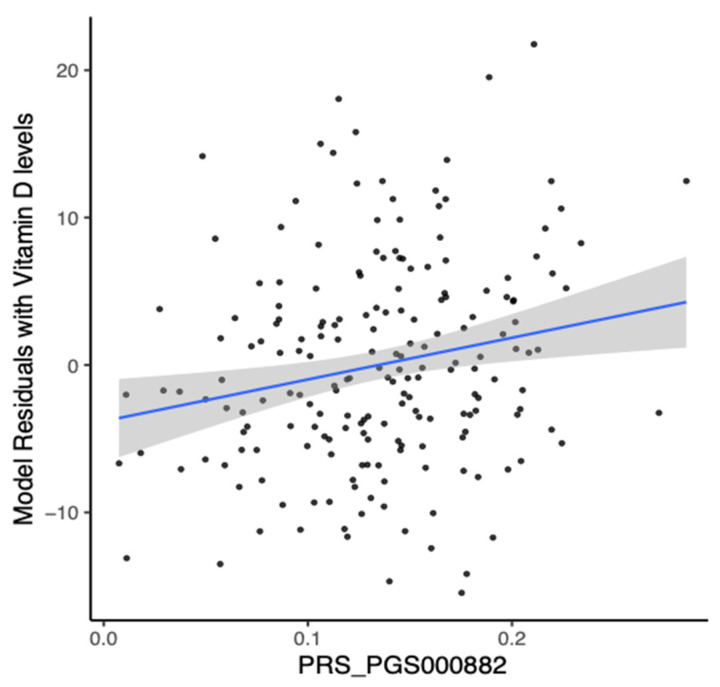
Figure 4.
Performance of polygenic risk score derived from European population on the Lebanese individuals. Linear regression of the baseline levels of 25(OH)D and European-derived polygenic risk scores (PRS) (PGS000882: R = 0.2033, p-value = 0.0044). The blue line corresponds to the linear regression analysis, representing the best fit of the data.

