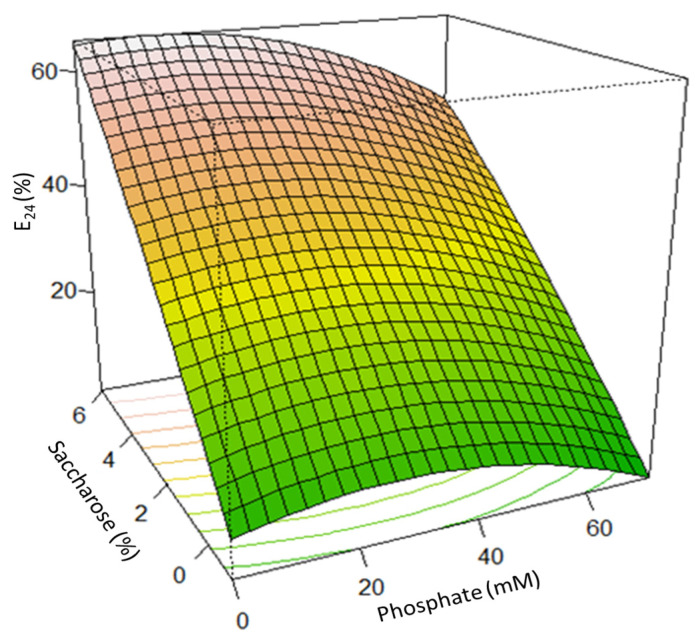
Figure 1.
Effect of the saccharose (%) and phosphate (mM) concentrations on the emulsifying activity, expressed as E24 (%) of the B3-15 cell-free supernatant. The different colors on the surface plot represent the gradient range, from the lowest (green) to the greatest (light-red), for the BS production.

