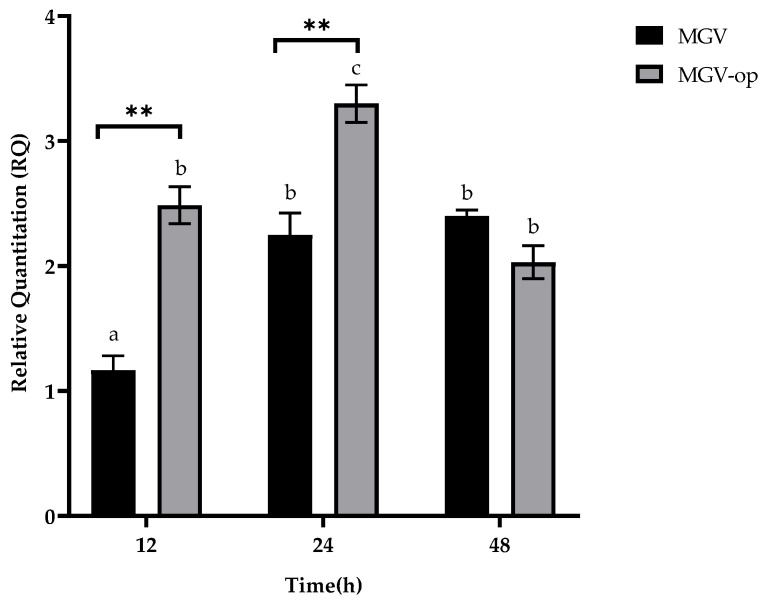
Figure 5.
Relative quantitation (RQ) of lchAA at different incubation times (12, 24, and 48 h) of B3-15 in MGV or MGV-op. The bars represent mean ± SD for three replicates (n = 3). Statistical differences were evaluated using two-way ANOVA with Tukey’s multiple comparisons tests. Significantly different ** p ≤ 0.01 compared with untreated controls. Different lowercase letters above the bar graph indicate significant statistical differences (p < 0.01).

