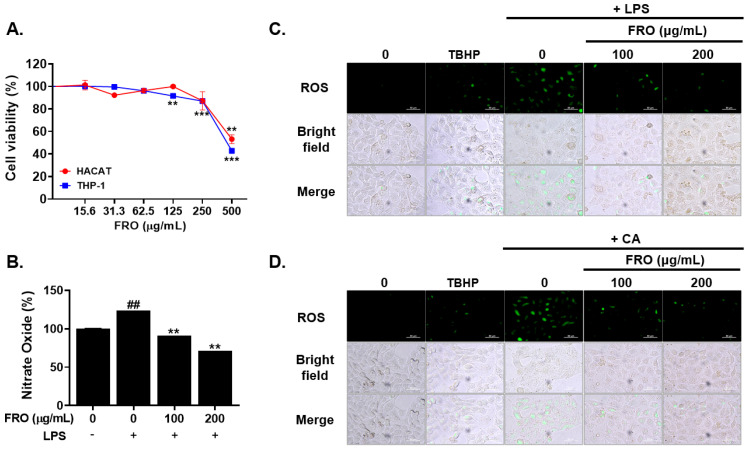
Figure 5.
Inhibitory effect of FRO on ROS and NO production in LPS-or CA-treated THP-1 or HaCaT cells. (A) HaCaT and THP-1 cells were treated with the indicated concentrations of FRO for 24 h (n = 3). An MTS assay was used to measure cell viability. The results are presented as the mean ± SD of three independent experiments. ** p < 0.01 and *** p < 0.001 versus control groups. (B) THP-1 cells were treated with FRO (0, 100, and 200 μg/mL) for 24 h (n = 3). Nitric oxide (NO) production was evaluated using the Griess method. The results are presented as the mean ± SD of three independent experiments. ## p < 0.01 (control versus the LPS-treated control group) and ** p < 0.05 (versus the LPS-treated control group). (C) LPS- or (D) CA-treated HaCaT cells were treated with FRO (0, 100, and 200 μg/mL) for 24 h or TBHP 50 μM (positive control) for 4 h. The HaCaT cells were stained with a DCFDA solution and incubated at 37 °C for 45 min. Fluorescence was monitored using a fluorescence microplate reader.

