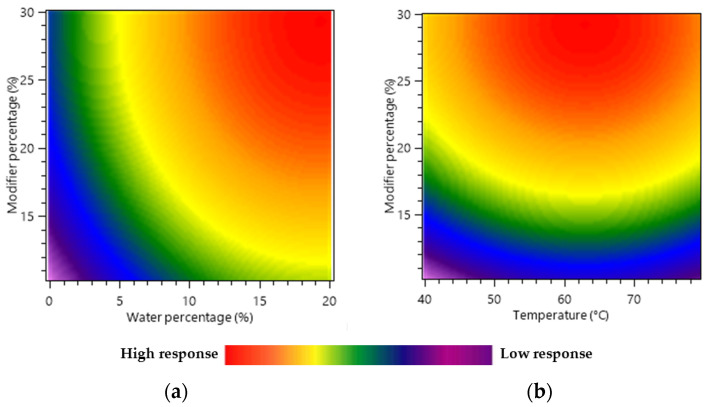
Figure 2.
Response surface heat maps showing the interactive effects of the variables on the total molecule yield (mg/g) of green tea leaf extracts. (a) Interaction between the modifier’s percentage (X2) and water in modifier percentage (X3), (b) interaction between the modifier’s percentage (X2) and temperature (X1).

