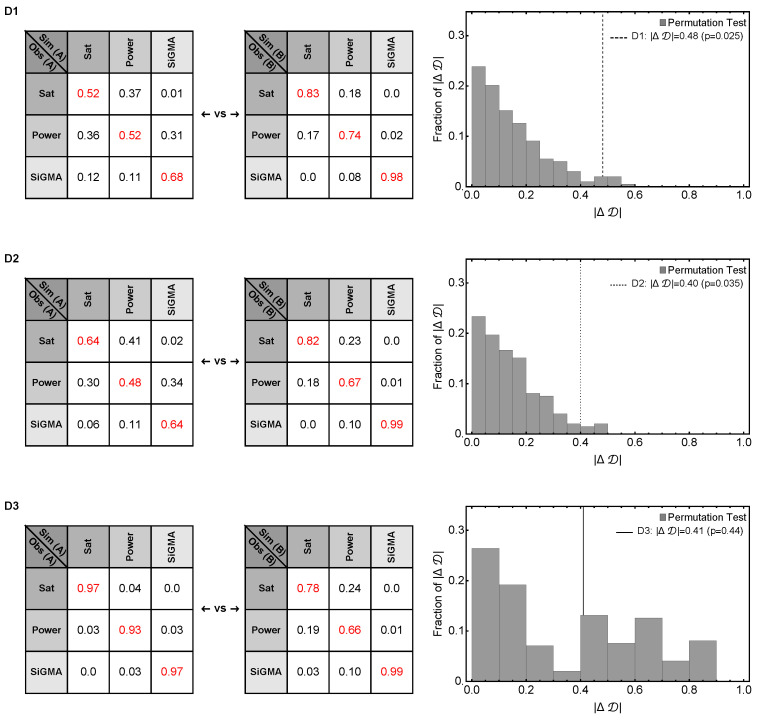
Figure A5.
Statistical power to detect a difference in fit quality between alternative mathematical models depends on experimental design. We performed simulations of 3 experimental designs measuring impact of CTLs on B16 tumor dynamics (see Figure 5 and Main text for details). For designs D1 and D2 we show that the experiment type A and B are significantly different from each other. With permutation test, however, for D3 we fail to reject the null hypothesis that the experiments are similar. For three simulated experimental designs D1, D3 and D3 we simulated 100 identical replicas for investigation Type A and B from a model while choosing the errors randomly and then fit them with models. This allowed us to get matrices like the ones in the left 2 panels. The red diagonal entries show fraction of replicas generated by the a model is also best fit by the same model where as the off diagonal entries present fraction of replicas generated by a model but best fit by a different model. The experimental Type A or B with heavier diagonal terms would indicate a better experiment. In this plot we did a permutation test to compare the observed in a permutated distribution of to obtain a p-value, where is a determinant of the matrices. This test allowed us to statistically comment on the structural difference of the design Types A and B. The details of the test is discussed in the end of Results section. See Equation (12) for test statistic measure.

