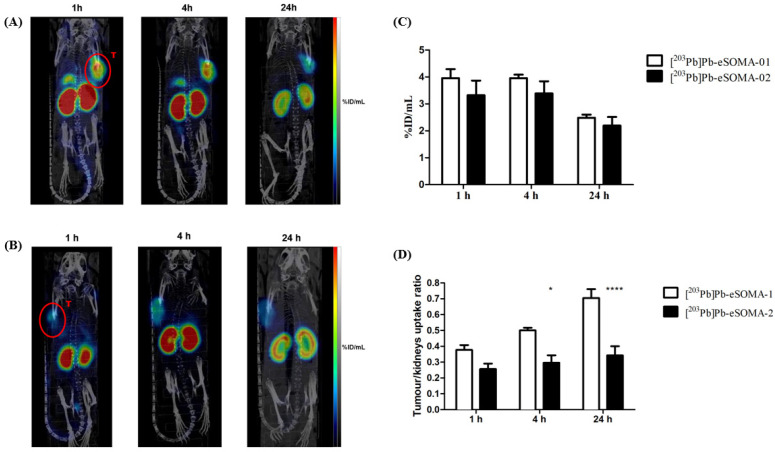
Figure 3.
SPECT/CT scans of H69 tumor-bearing mice (n = 4) after administration of [203Pb]Pb-eSOMA-01 (A) and [203Pb]Pb-eSOMA-02 (B). Tumors were located on the right or left shoulder (red T). Tumor uptake is expressed as a percentage of injected dose per mL (% ID/mL) (C) and tumor/kidney ratios (D) derived from the SPECT images. * p < 0.05; **** p < 0.0001.

