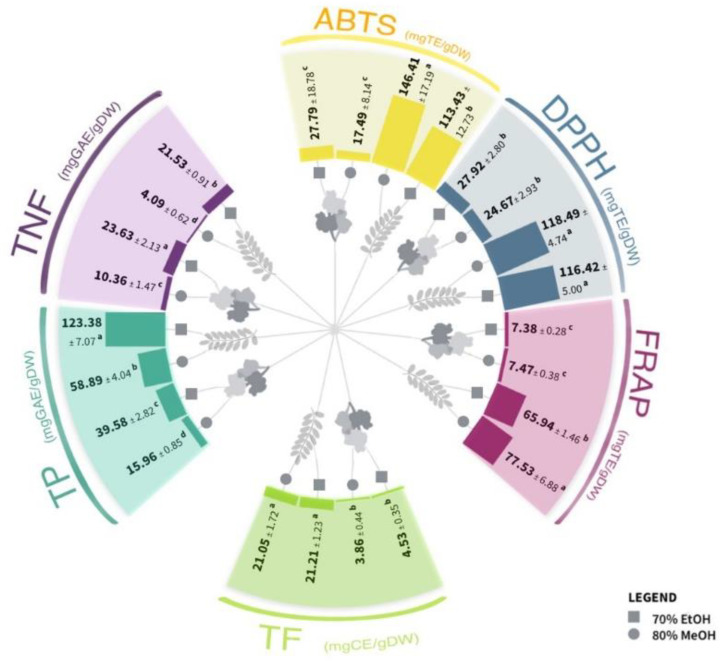
Figure 1.
The content of total phenolics (TP), total non-flavonoids (TNF), and total flavonoids (TF) and antioxidant capacity (obtained by DPPH (2,2-diphenyl-2-picrylhydrazyl) free radical assay, ABTS [2,2′-azino-bis (3-ethylbenzothiazoline-6-sulphonic acid)] radical cation assay, and FRAP (ferric reducing antioxidant power) assay) in Robinia pseudoacacia leaf and flower extracts in two solvents. Different letters (a–d) in the same section indicate significant differences between the measured values (two-way ANOVA, Tukey’s test, p ≤ 0.01). The results are expressed in gallic acid equivalents per g of dry weight (mg GAE/gDW) for TP and TNF and for TF in catechin equivalents per g of dry weight (mg CE/gDW).

