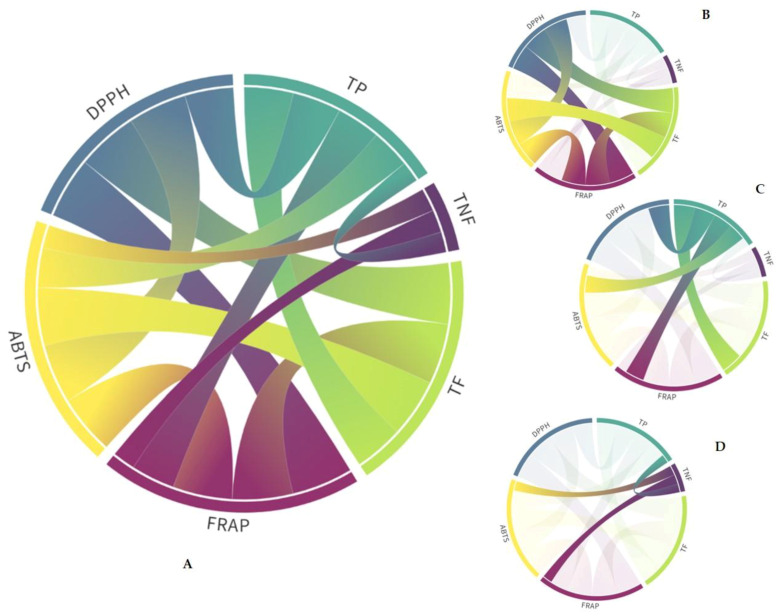
Figure 2.
Pearson’s correlation coefficients of total phenolics (TP), non-flavonoids (TNF), and flavonoids (TF) contents and antioxidant capacities determined by ABTS [2,2′-azino-bis (3-ethylbenzothiazoline-6-sulphonic acid)] radical cation assay, DPPH (2,2-diphenyl-2-picrylhydrazyl) free radical assay, and FRAP (ferric reducing antioxidant power) assays. (A) Only significant correlations (p ≤ 0.05; p ≤ 0.01; Table S1) are shown. (B) Total correlations (0.9 < r < 1.0). (C) Very strong and strong correlations (0.50 < r < 0.9). (D) Weak correlations (0.25 < r < 0.4).

