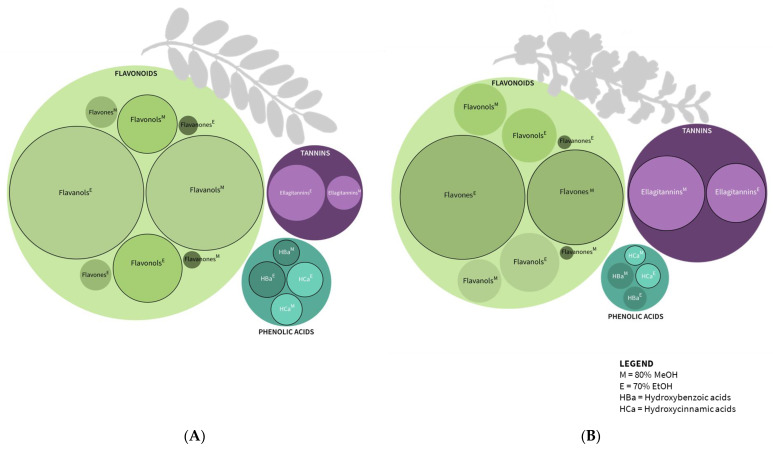
Figure 3.
The main phenolic groups obtained by the LC-DAD-MS method in the (A) leaf and (B) flower extracts. The ratio of the circles’ sizes corresponds to the total concentration of individual phenolic groups (mg/g of dry weight (DW)). The circle border indicates statistically significant differences between concentrations of individual phenolic groups within the plant organ (ANOVA, Tukey’s test, p ≤ 0.01).

