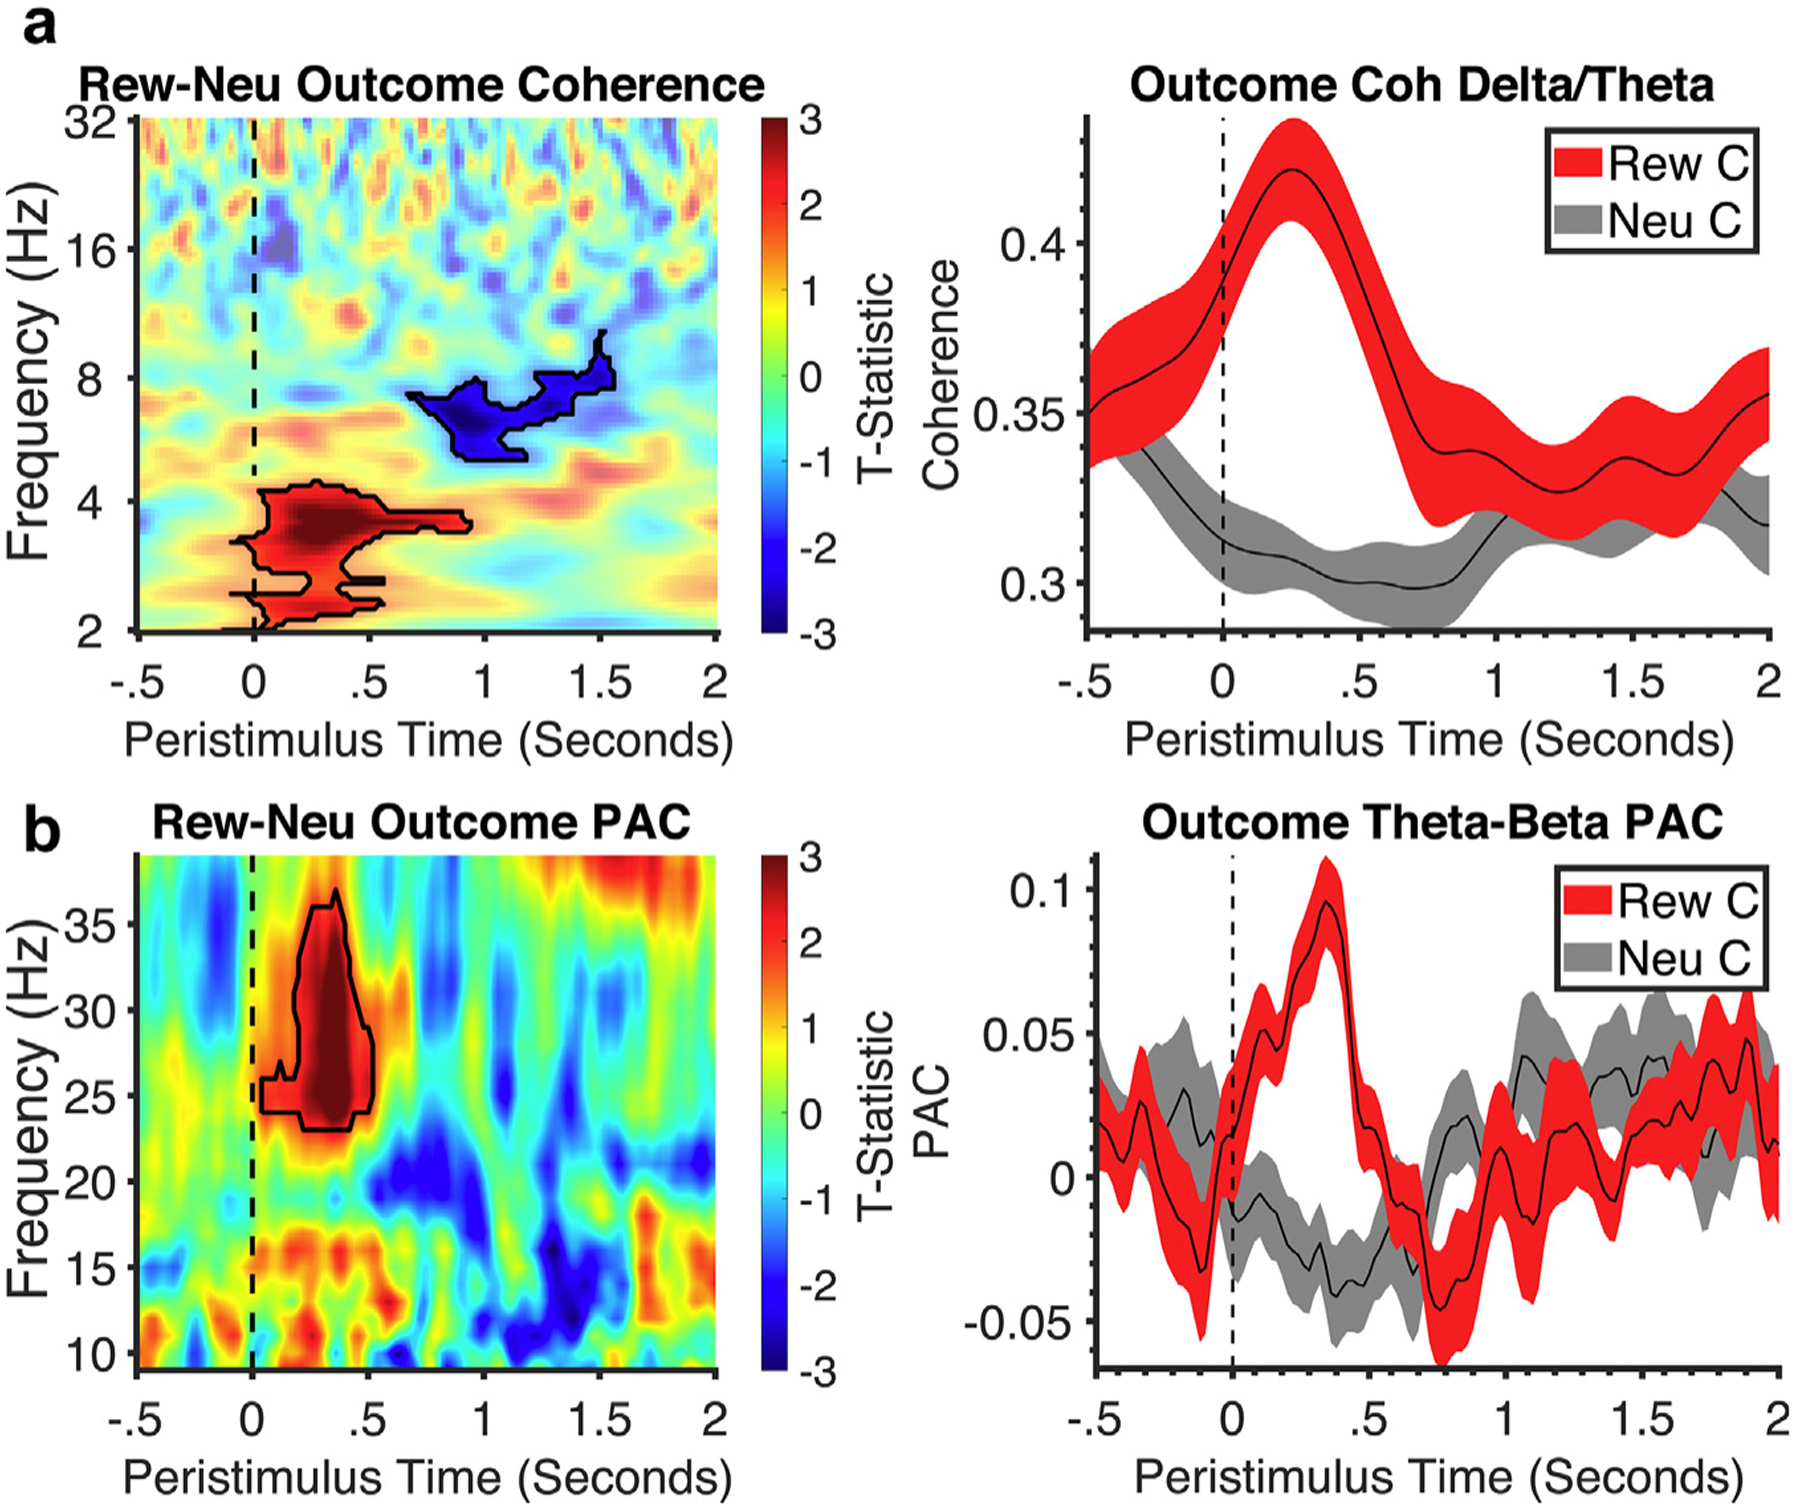
Figure 5.

Time-frequency coherence analysis of outcome. a. Time-frequency analysis of prefrontal EEG and subthalamic (STN) coherence for reward vs neutral with no significant findings in loss vs neutral. Black outlines symbolize clusters in reward outcomes that were significantly larger than neutral. All clusters had a false discovery rate cluster size significance of p < 0.002. Corresponding line plots below represent % signal change and standard error from the significant cluster identified in the time-frequency plot: delta-theta activity for reward and neutral. b. Time-frequency analysis of STN theta-beta phase-amplitude coupling for reward vs neutral. Black outlines symbolize clusters in reward outcomes that were significantly larger than neutral. All clusters had a false discovery rate cluster size significance of p < 0.002. Corresponding line plots below represent % signal change and standard error from the significant cluster identified in the time-frequency plot: theta-beta coupling activity for reward and neutral. C, correct; Neu, neutral; Rew, reward.
