
Figure 6.
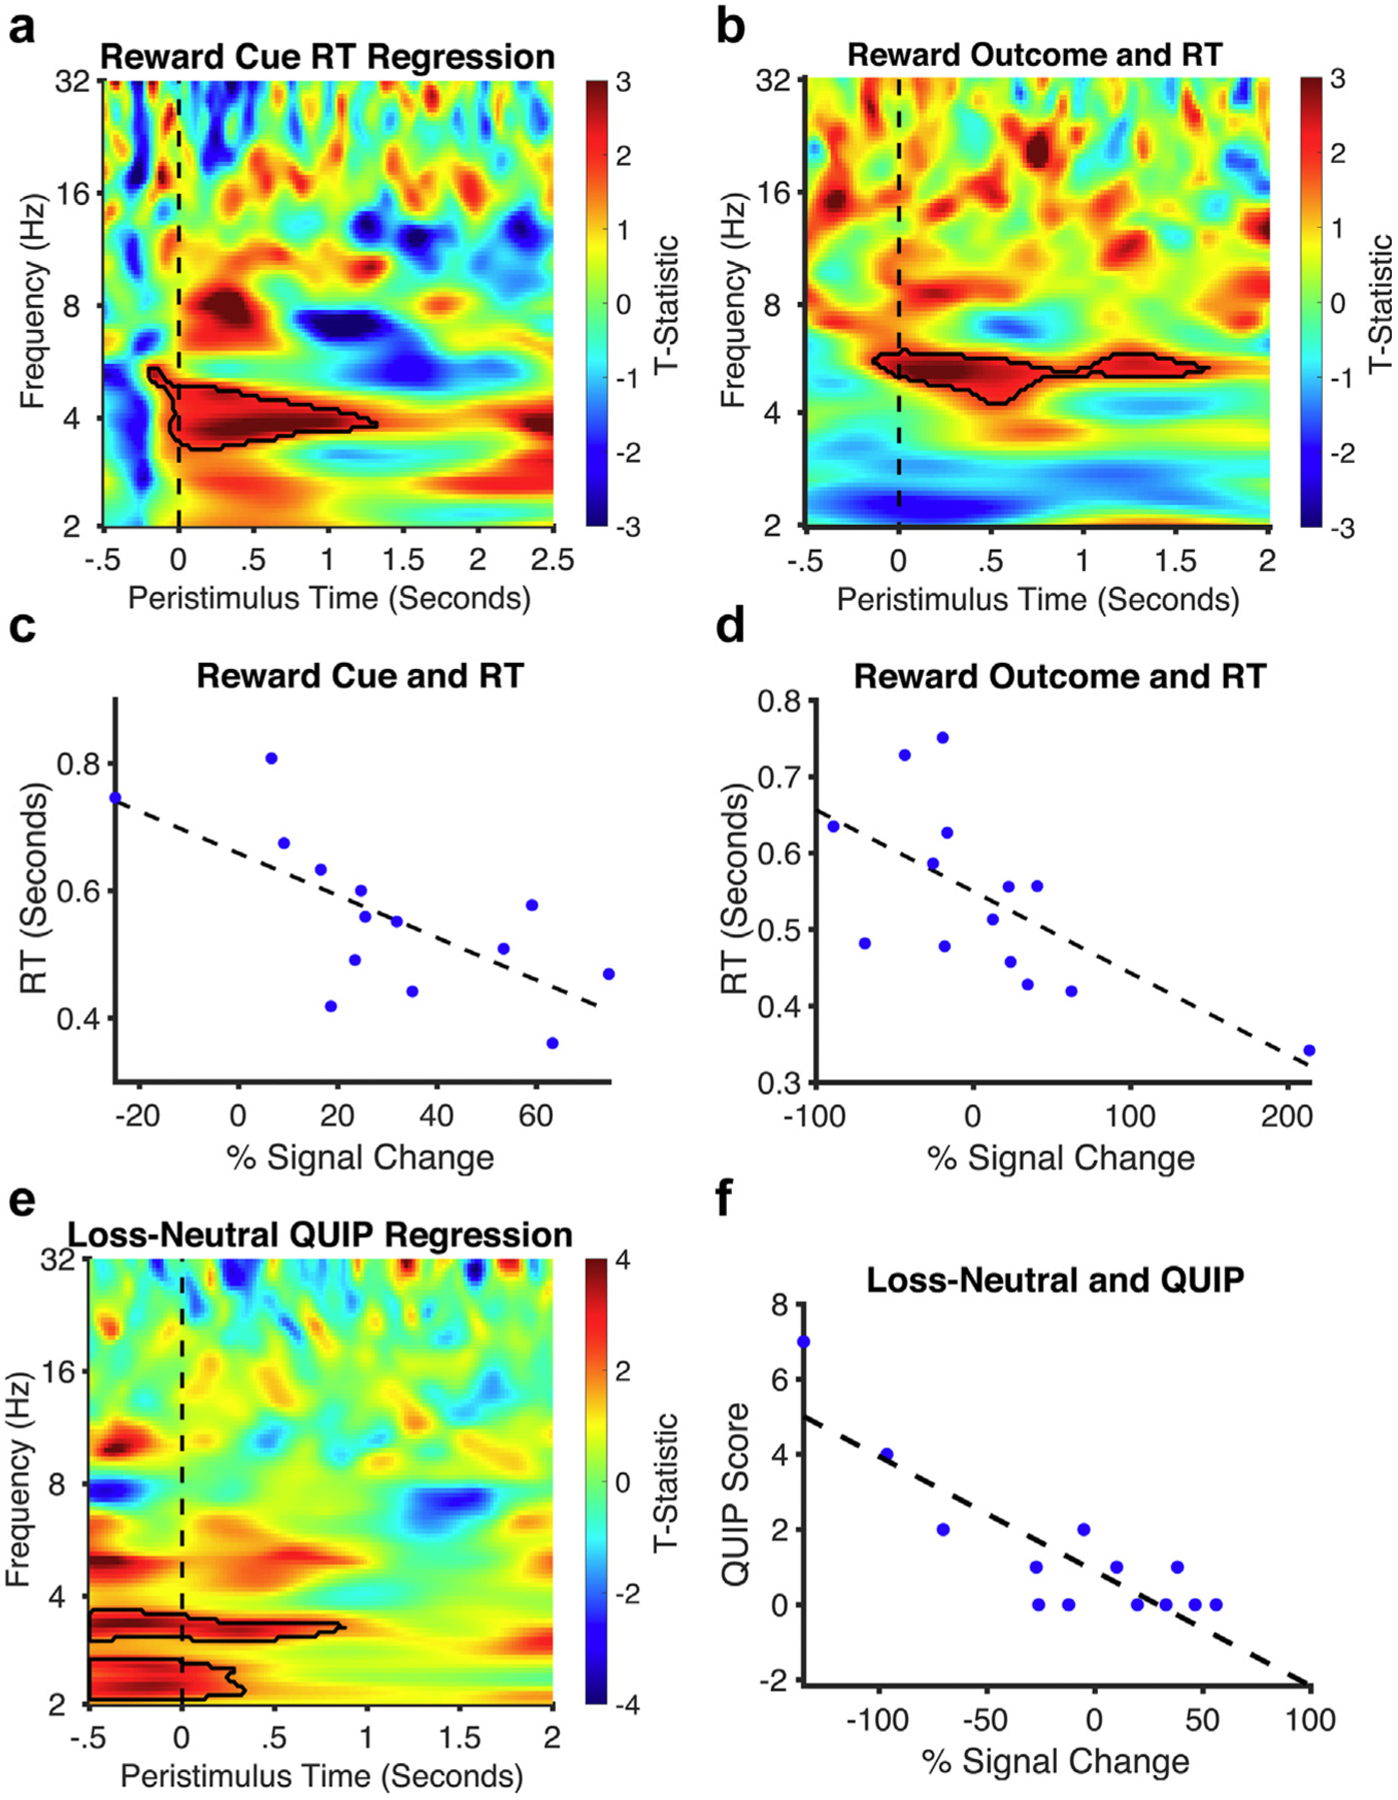
Regression analyses with RT and addiction scores. a and b. The time-frequency regression analysis plot of both the reward cue and outcome show greater low-frequency oscillatory activity to faster RTs (an index of higher motivation). Black outlines symbolize clusters in reward outcomes that were significantly larger than neutral. c and d. Corresponding regression plots show individual % signal change of significant findings and their relationship to RT. e and f. The time-frequency regression analysis plot of the loss vs neutral outcome shows lower delta activity to higher QUIP scores (an index of addiction severity).