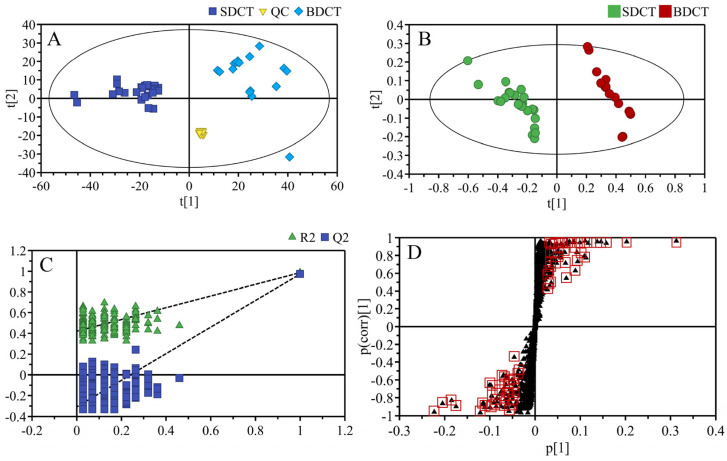
Figure 2.
Multivariate statistical analysis of PCA score plot (A), PLS–DA score plot (B), cross-validation plot of PLS–DA model with 200 permutations (C), and S–plot of PLS−DA (D) for the two grades of high-quality DCT. The black triangles with red squares represent the potential important compounds.

