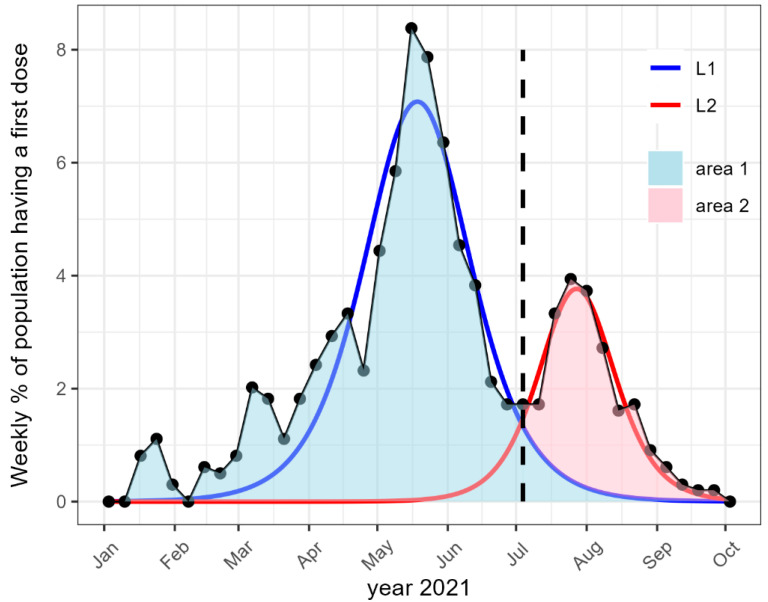
Figure 1.
Illustration of the counterfactual approach used to analyze the weekly vaccination rate (dots) of a given EPCI and age category. The blue line and the red lines represent the fits L1 and L2 of the two peaks obtained with the innovation diffusion model. The blue area represents the counterfactual estimation of the cumulative percentage of the population without COVID-19 certificate. The red area is the estimated additional vaccine uptake due to the COVID-19 certificate.

