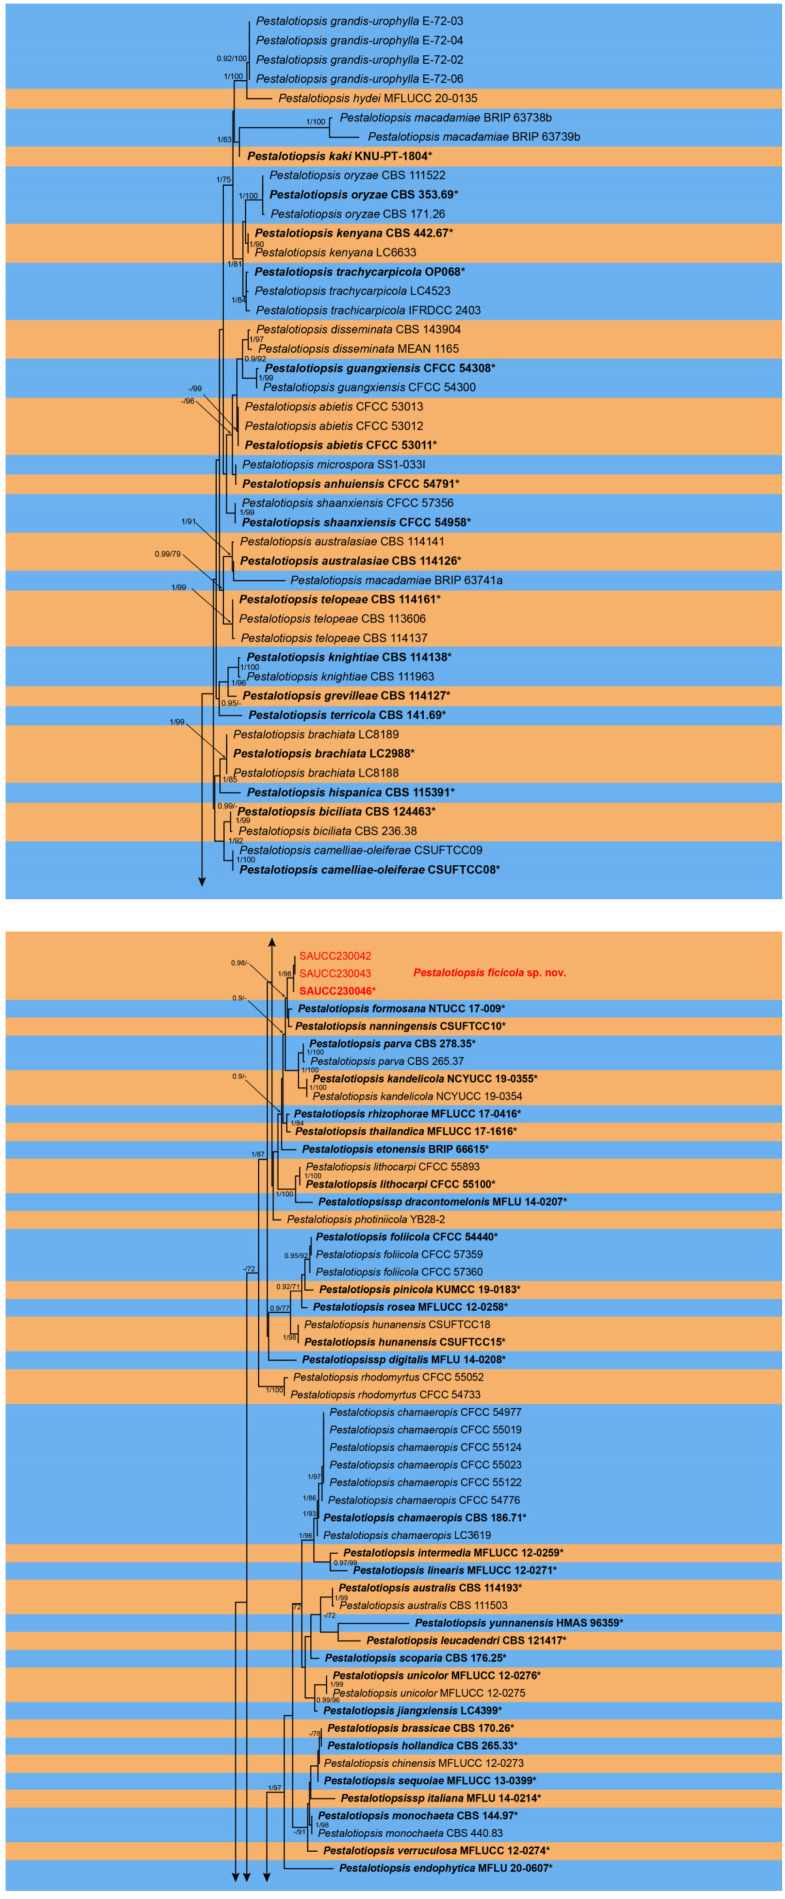
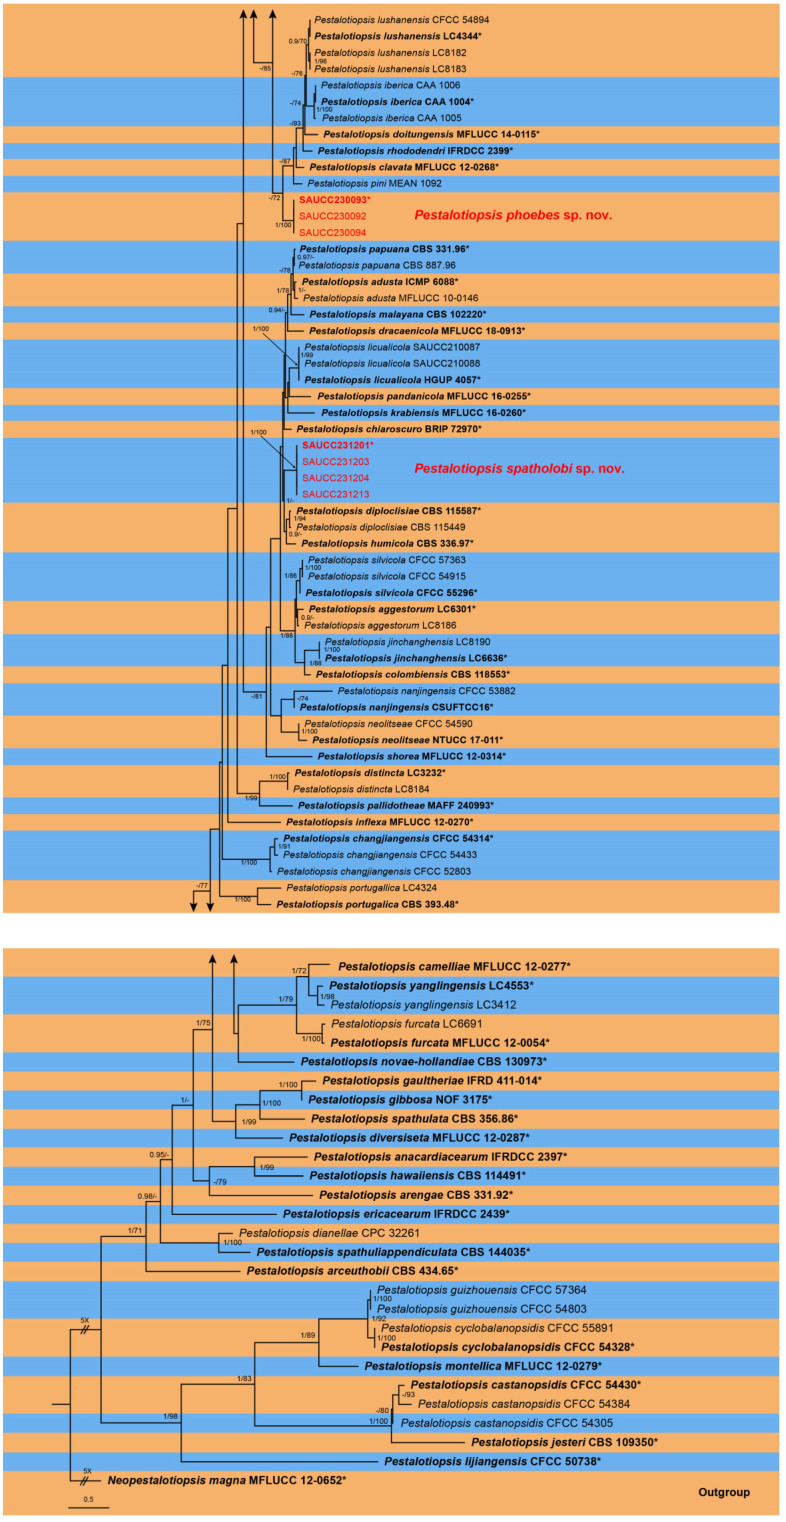
Figure 1.
A phylogram of the Pestalotiopsis with Neopestalotiopsis magna (MFLUCC 12-0652) as outgroup based on a concatenated ITS, tef1α and tub2 sequence alignment (only shows the topology of the ML tree). BI posterior probabilities and maximum likelihood bootstrap support values above 0.70 and 90% are shown at the first and second position, respectively. Ex-type cultures are marked in bold face and *. Strains obtained in the present study are in red. Some branches are shortened for layout purposes—these are indicated by two diagonal lines with the number of times. The orange and blue areas are used to distinguish different species. The scale bar at the left–bottom represents 0.5 substitutions per site.


