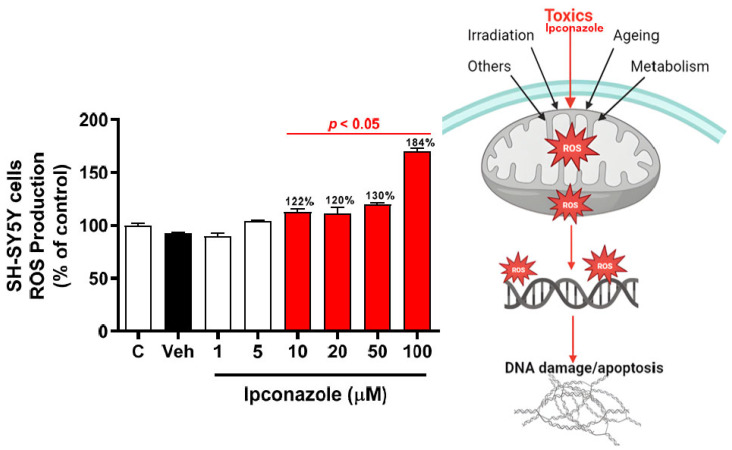
Figure 2.
ROS production induced by ipconazole (1, 5, 10, 20, 50, and 100 µM) on SH-SY5Y cells after 24 h incubation period. ROS production was determined with DCFH-DA assay. Data are presented as fluorescence units and as mean ± SEM of six repetitions. Ipconazole concentrations (red bars: 10, 20, 50, and 100 µM) show significant differences (p < 0.05) compared with the vehicle (Veh, black bar). The figure on the right shows the possible mechanism of ROS production induced by toxic compounds such as ipconazole (adapted from [17]).

