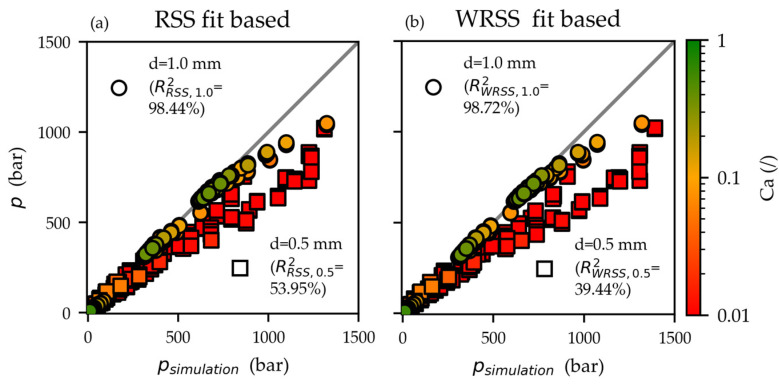
Figure 10.
Contrasting of measured HPCR pressures with the simulated pressures based on the Cross-WLF parameter fits RSS (a) and WRSS (b). A better agreement exists between measured and simulated values for the capillaries (circular symbols) than the narrower capillaries (square symbols). Low Cameron numbers (Equation (12)) suggest non-isothermal conditions. It could explain the overestimation of the pressures in the isothermal simulations.

