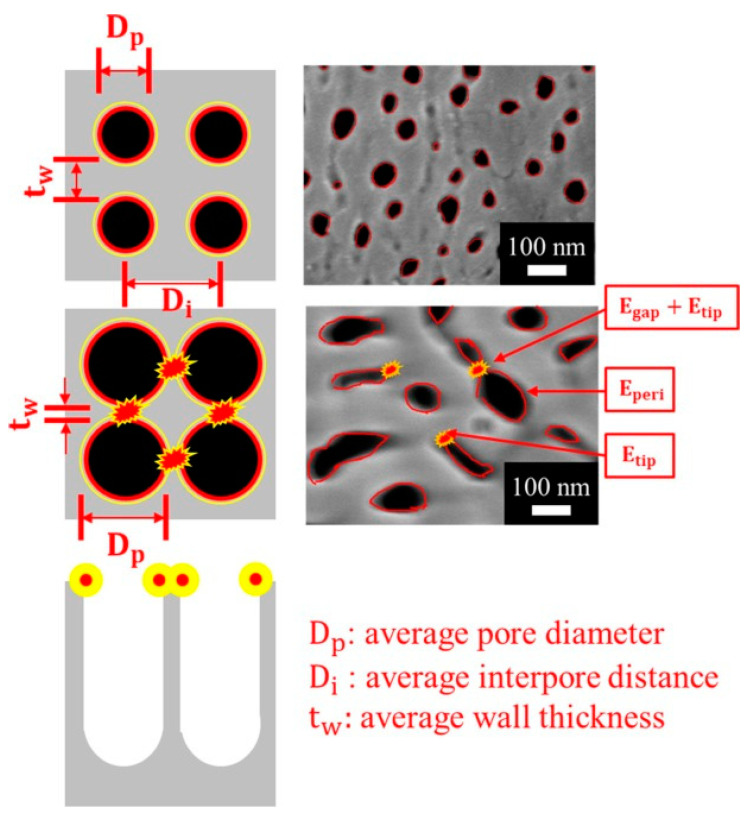
Figure 9.
The schematic pore–peripheral–plasmonic mechanism of SERS substrate using metal-AAO-Al. The red lines around the pores are the positions where the plasmonic oscillation is the strongest, denoted as Eperi, and the yellow lines are the boundary of the plasmonic oscillation. The small gap, tw = Dp − Di, between two neighboring pores or the high-curvature tips of pores to form extra hot spots are denoted as Egap and Etip, respectively.

