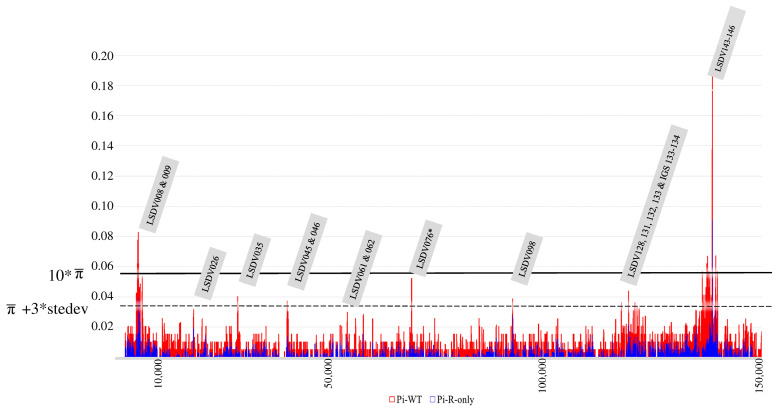
Figure 5.
Combined π-plot of wild-type LSDV WGS (red) and recombinant LSDV WGS (blue). The genomic regions displaying peaks with >average π- + 3 times standard deviation are indicated in the grey labels. Labels with * are only affected in wild-type strains. Identification is based on the annotation of the sequence belonging to the LSDV reference strain NC_003027. The 10 * average π-value (based on the >2017 dataset) is indicated by a solid line. The average π-value + 3 times standard deviation is indicated in the figure by a dashed line. The x-axis denotes the genomic position; the y-axis denotes the π-values.

