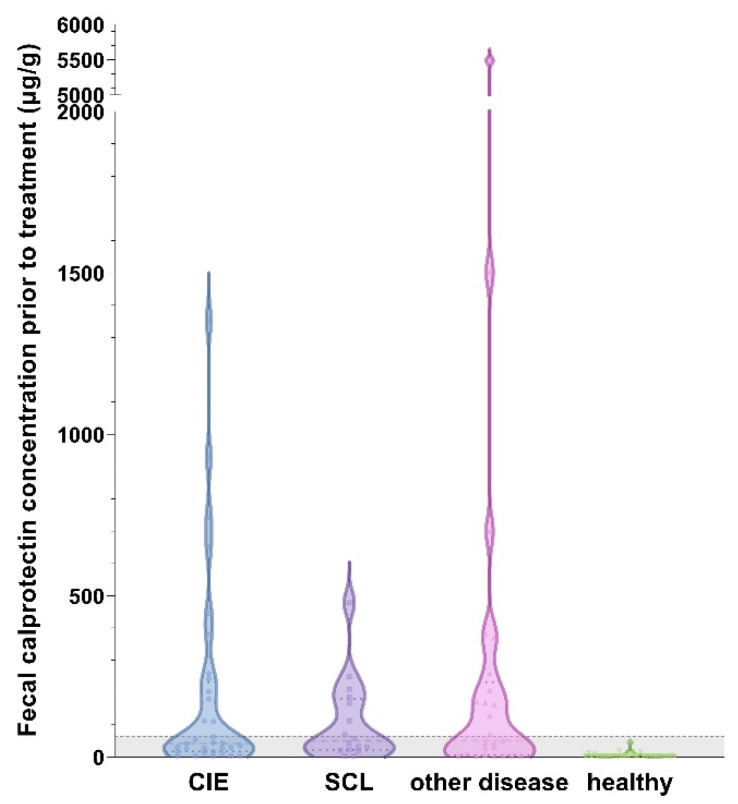
Figure 2.
Violin plot showing fecal calprotectin (fCal) concentrations in all cats (n = 99) included in the study. All disease groups of cats had significantly higher fCal concentrations than healthy control cats (all p < 0.0001), with no differences among cats with chronic inflammatory enteropathy (CIE), small-cell alimentary lymphoma (SCL), or other gastrointestinal (GI) or extra-GI diseases (all p > 0.05). A total of 22 cats in the CIE group, 10 cats in the SCL group, 7 cats in the diseased control group, and all of the healthy controls had fCal levels within the reference interval. Gray-shaded area below the horizontal dashed line represent the reference interval (<64 µg/g) [43]. Note the broken y-axis.

