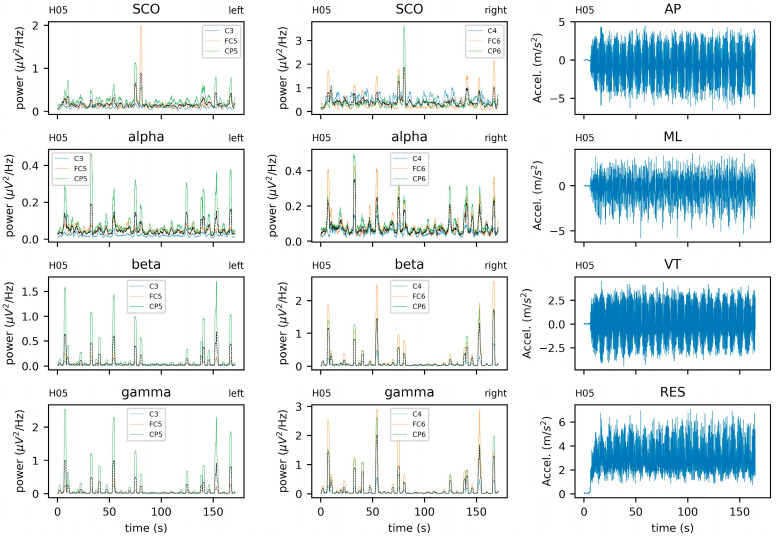
Figure 4.
Electroencephalogram (EEG) and center of mass (COM) data from a single subject (H05) EEG data include alpha, beta, gamma, and combined theta/delta (SCO) bands. Black lines represent averages across three intrahemispheric channels. COM data include anteroposterior (AP), mediolateral (ML), vertical (VT), and resultant (RES) accelerations. Data from the additional subject (H07) is provided in the Supplementary Materials.

