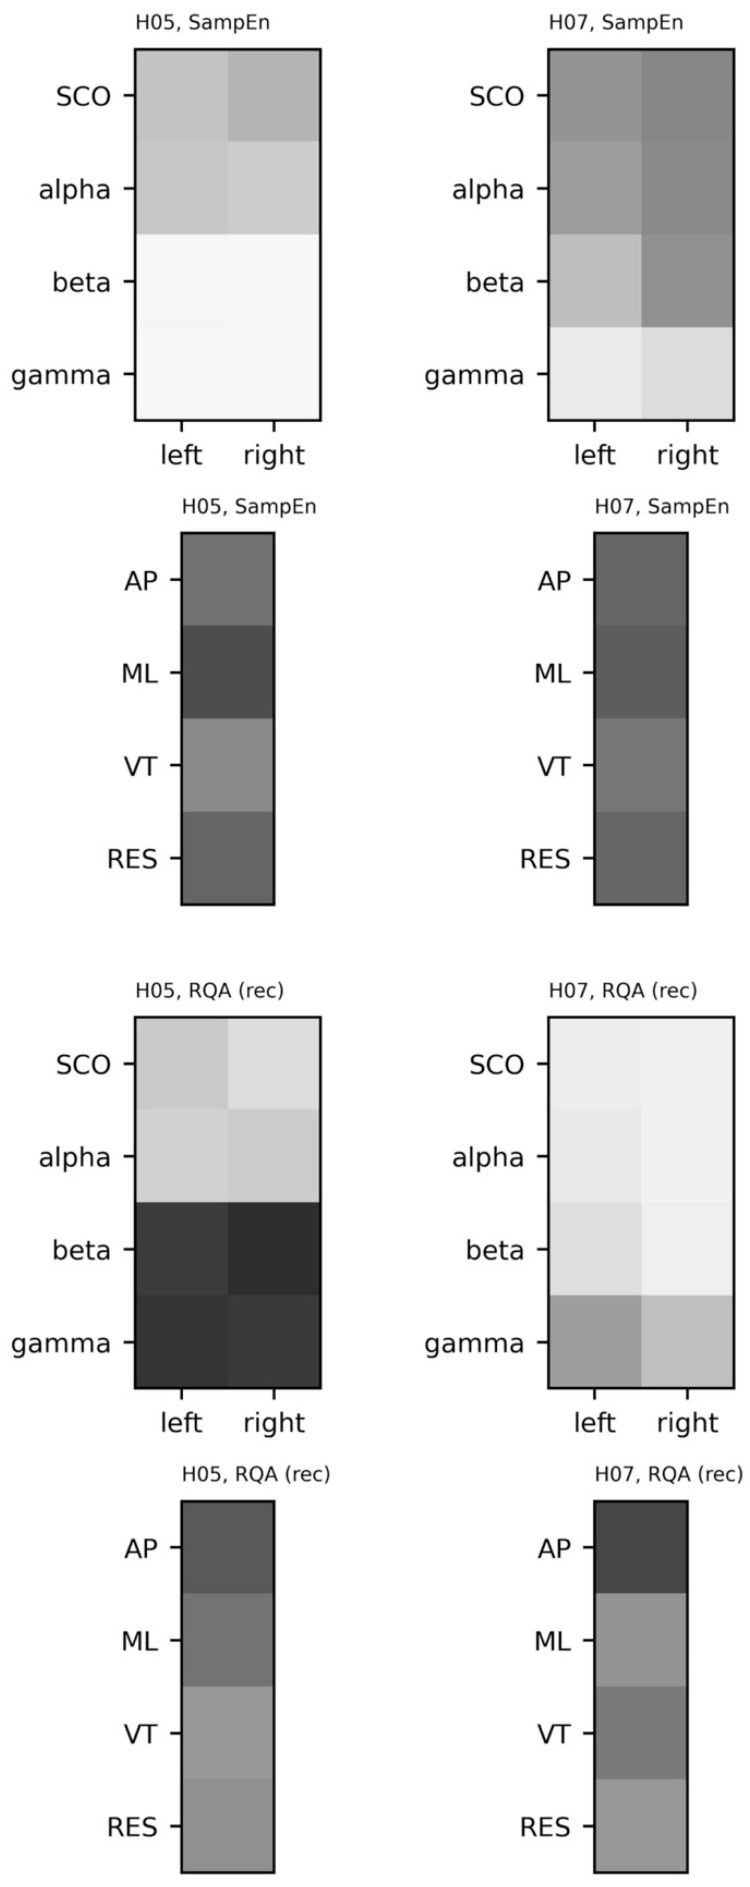
Figure 10.
Sample entropy and percent recurrence (RQA) for electroencephalogram (EEG) data from each subject (columns). EEG data include alpha, beta, gamma, and combined theta/delta (SCO) bands. COM data include anteroposterior (AP), mediolateral (ML), vertical (VT), and resultant (RES) accelerations. Sample Entropy: {EEG: m = 3, r = 0.2, τ = 16; COM: m = 2, r = 0.2, τ = 16}. RQA: {EEG: m = 3, r = 0.3, τ = 16; COM: m = 3, r = 0.75, τ = 16}. Data were scaled relative to the highest value observed across subjects; darker shades represent higher sample entropy and recurrence rates from RQA.

