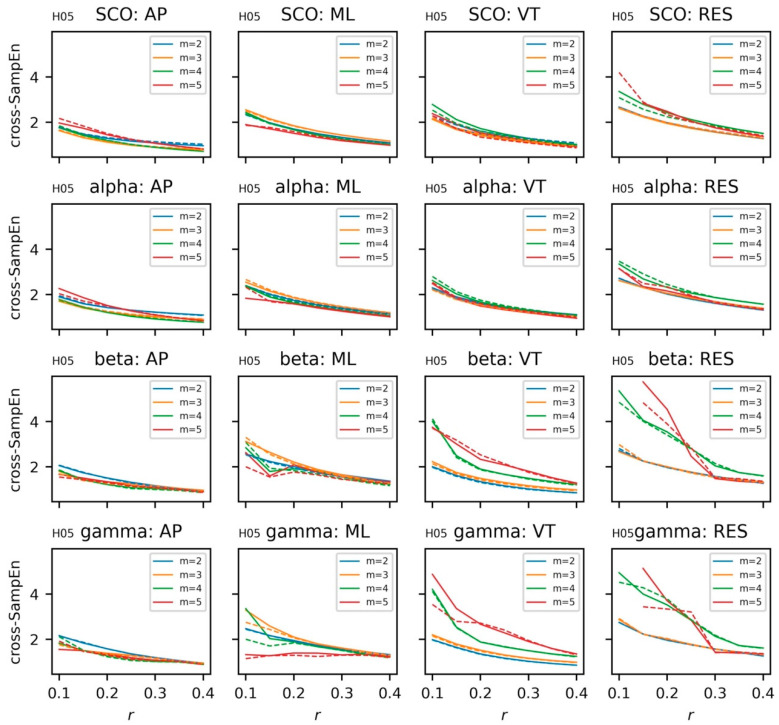
Figure 11.
Cross-sample entropy for electroencephalogram (EEG) data from a single subject. EEG data include alpha, beta, gamma, and combined theta/delta (SCO) bands. COM data include anteroposterior (AP), mediolateral (ML), vertical (VT), and resultant (RES) accelerations. Solid lines denote the left hemisphere; dashed lines denote the right hemisphere. {m = (2, 3, … 5), r = (0.1, 0., … 0.40), τ = 16}. Plots for the additional subject (H05) can be found in the Supplementary Materials.

