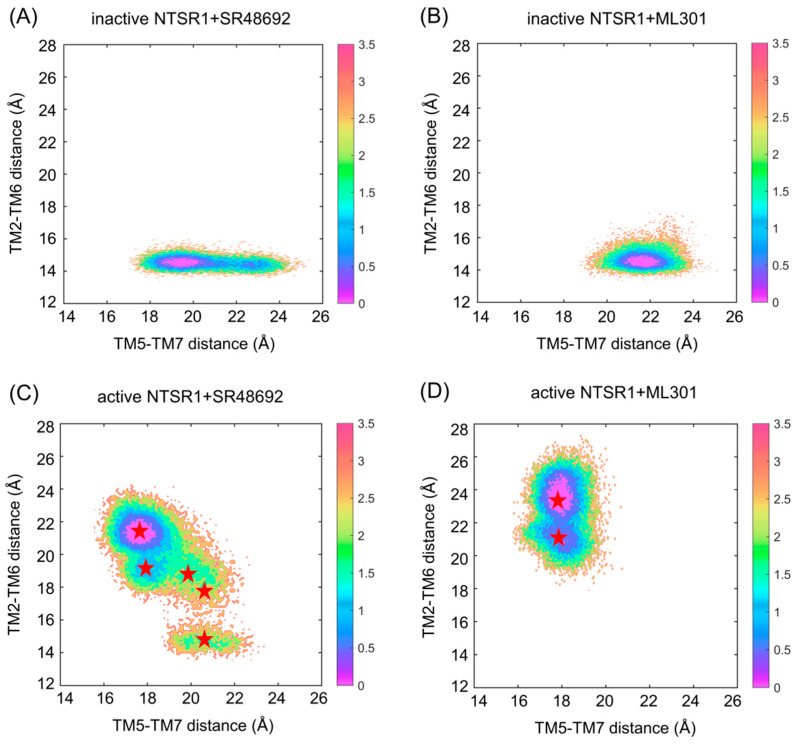
Figure 2.
The free energy landscapes of the inactive NTSR1 + SR48692 system (A), the inactive NTSR1 + ML301 system (B), the active NTSR1 + SR48692 system (C), and the active NTSR1 + ML301 system (D) are shown by simulation trajectory projection. Collective variable 1 (CV1): TM5–TM7 distance; CV2: TM2–TM6 distance. The color scales on the right were evaluated through density. The red stars denote the positions of representative structures extracted using K-means clustering.

