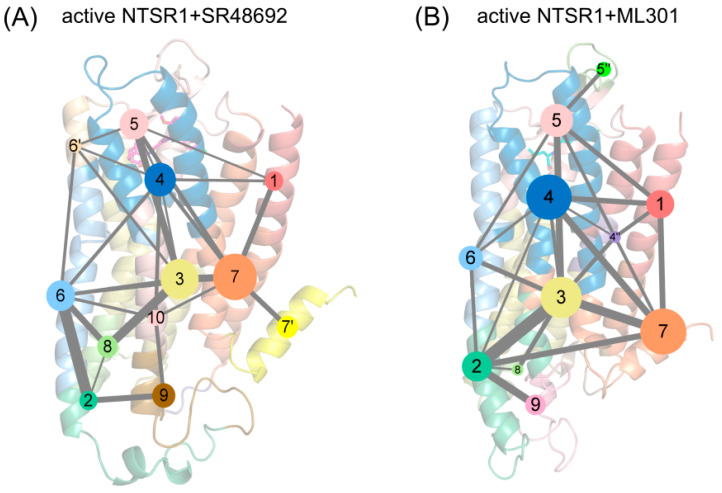
Figure 8.
The community network analysis of the active NTSR1 + SR48692 system (A) and the active NTSR1 + ML301 system (B). Each sphere represents a corresponding community whose number of residue components is indicated by the sphere area. Each number denotes a community in the network, and number with a superscript refers to a sub-community. While the sticks connecting different spheres visualize the inter-community connections, and the thickness of these sticks is proportional to the value of edge connectivity.

