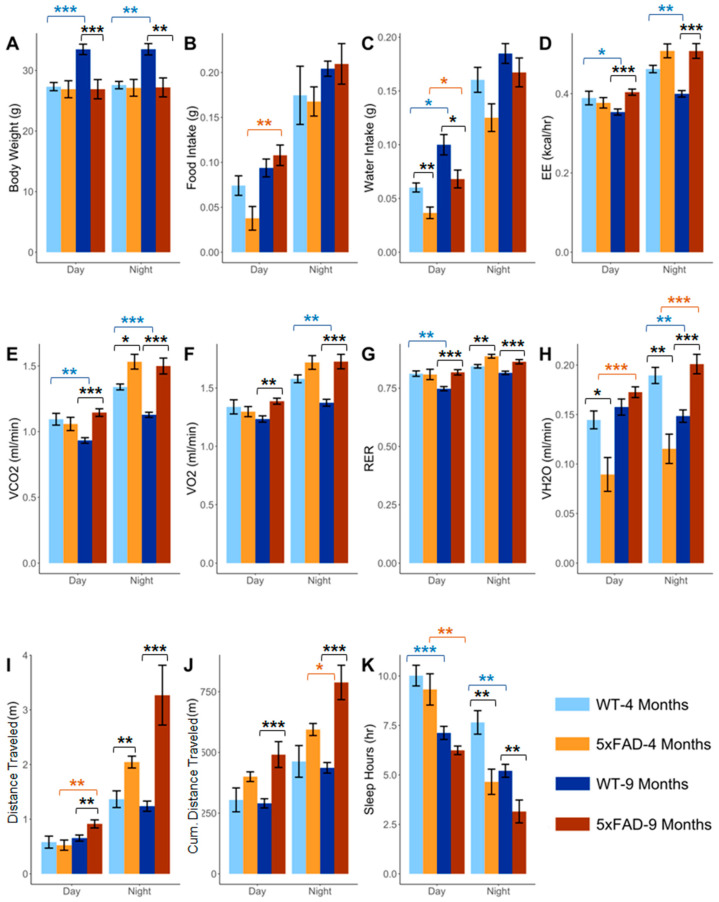
Figure 1.
The effect of aging and pathology on the metabolic parameters (A) Body weight (g), (B) Food intake (g), (C) Water intake (g), (D) EE (kcal/h), (E) VCO2 (mL/min), (F) VO2 (mL/min), (G) RER, (H) VH2O (mL/min), (I) Distance traveled (m), (J) Cumulative (Cum.) distance traveled (m), and (K) Sleep hours (h) in WT and 5xFAD mice at daytime and nighttime. The statistical significance is color-coded with blue stars indicating the difference in WT with age, orange stars indicating the difference in 5xFAD mice with age, and black stars indicating the difference between WT and 5xFAD mice. Data are presented as mean ± SEM for n = 10 mice/group. * p < 0.05, ** p < 0.01, and *** p < 0.001.

