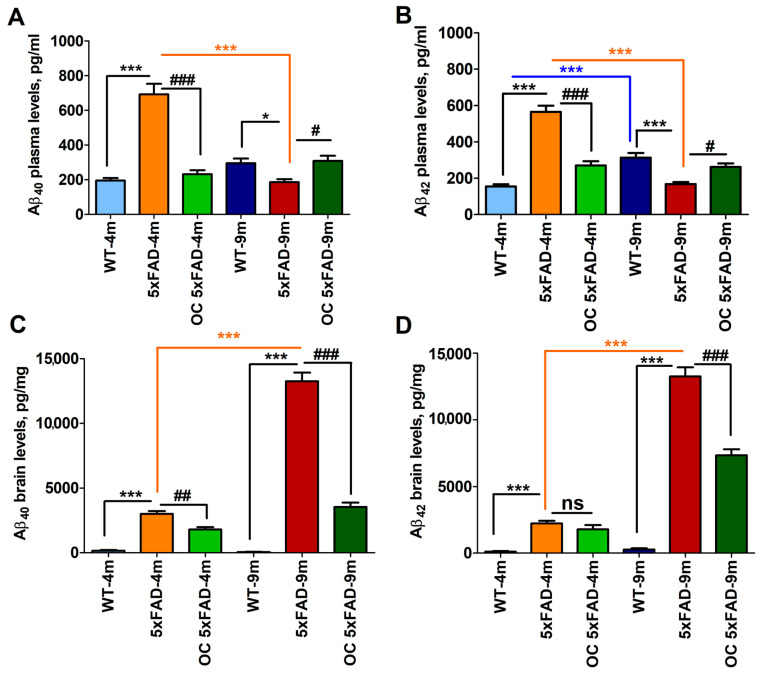
Figure 3.
The effect of age, pathology, and 10 mg/kg OC treatment on levels of soluble plasma Aβ40 (A) and Aβ42 (B) and brain Aβ40 (C) and Aβ42 (D) as determined using ELISA in WT and 5xFAD mice. The statistical significance is color-coded with blue stars indicating the difference in WT with age, orange stars indicating the difference in 5xFAD mice with age, and black stars indicating the difference between WT and 5xFAD mice. Data are presented as mean ± SEM (n = 10/group). ns for not significant, * p < 0.05, *** p < 0.001, # p < 0.05, ## p < 0.01, and ### p < 0.001.

