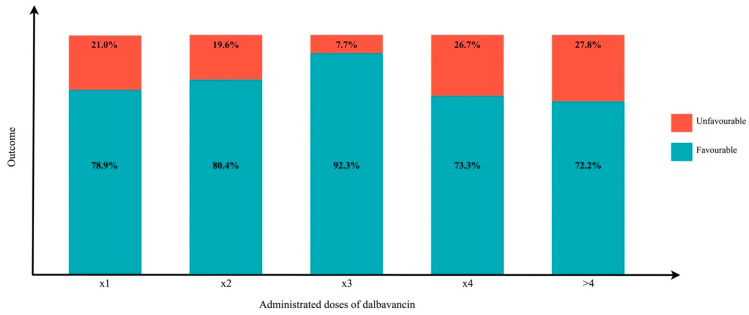
Figure 3.
Favourable versus unfavourable outcomes in different administration schedules of DBV: in the histogram every column represents the total number of patients treated with a specific number of doses of DBV, regardless of the interval of administration. The percentages represented in red and blue refer, respectively, to unfavourable and favourable outcomes.

