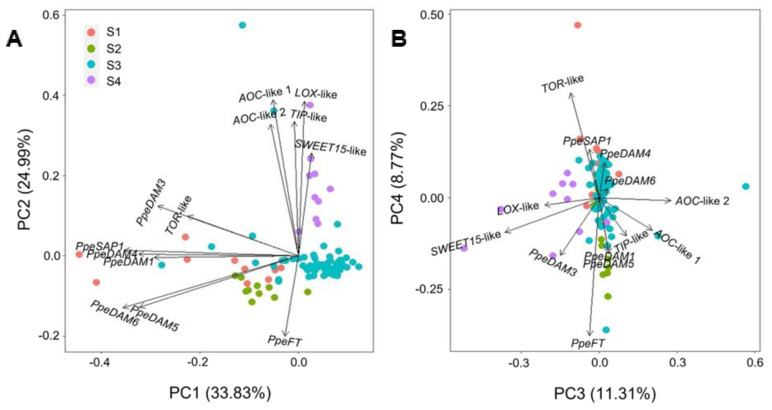
Figure 3.
Principal component analysis of gene expression. (A) Principal components, PC1 and PC2. (B) PC3 and PC4. Single buds are represented by circles with sample-specific colours. The directionality of the contribution of each gene is shown with black arrows. The percentage of the variance explained by the principal components is shown in parentheses.

