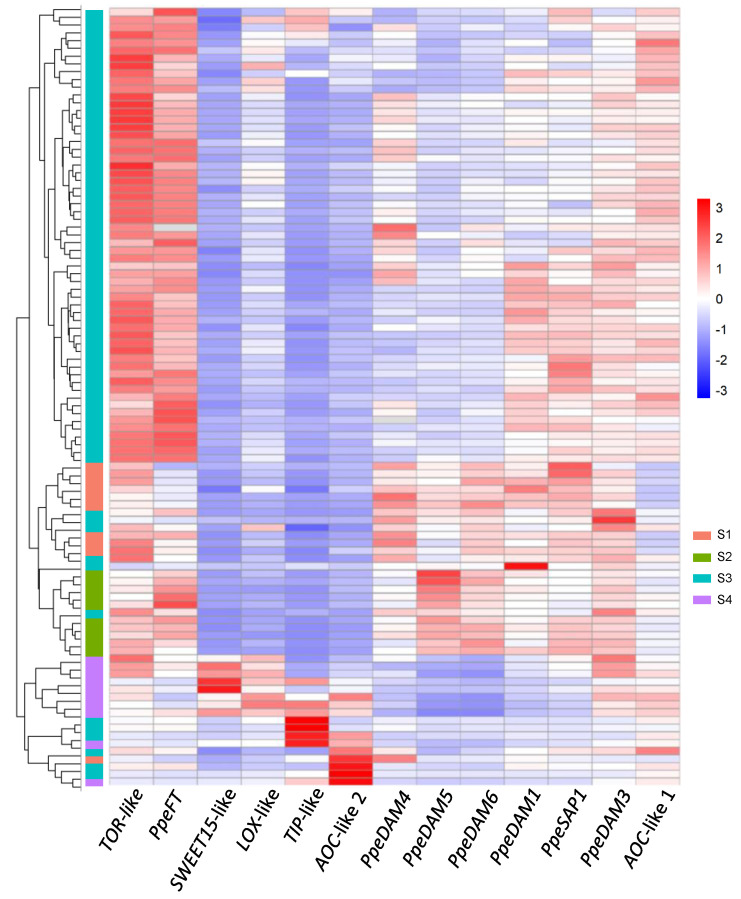
Figure 4.
Heat map and clustering of gene expression data. On the x-axis, genes under analysis. On the y-axis, clustered single-bud samples with their respective dendrogram. S1, S2, S3, and S4 individual samples are labelled with different colours. Gene expression values follow the colour scale shown in the legend.

