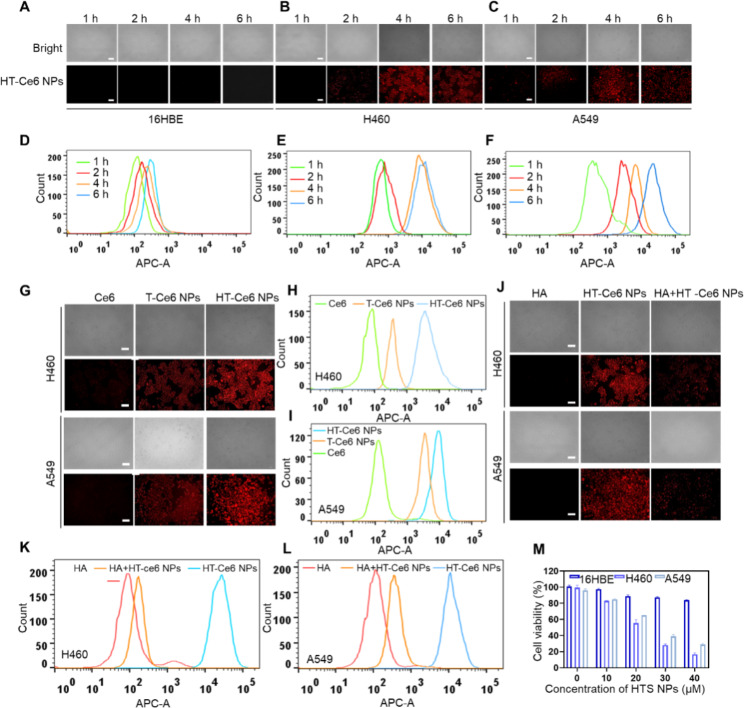
Fig. 2.
The cellular uptake and cytotoxicity of HTS NPs in vitro. (A-C) Confocal fluorescence images displaying cellular uptake of HTS NPs. Scale bar: 100 μm. (D-E) Flow cytometry analysis of the cellular uptake of HTS NPs. (G-I) Confocal fluorescence images and flow cytometry analysis showing cellular uptake of free Ce6, T-Ce6 NPs and HT-Ce6 NPs. Scale bar: 100 μm. (J-L) Confocal fluorescence images and flow cytometry analysis showing cellular uptake of HT-Ce6 NPs with or without HA. Scale bar: 100 μm. (M) The viability of 16HBE, H460 and A549 cells following treatment with HTS NPs. The error bars represent the means ± SD (n = 3)

