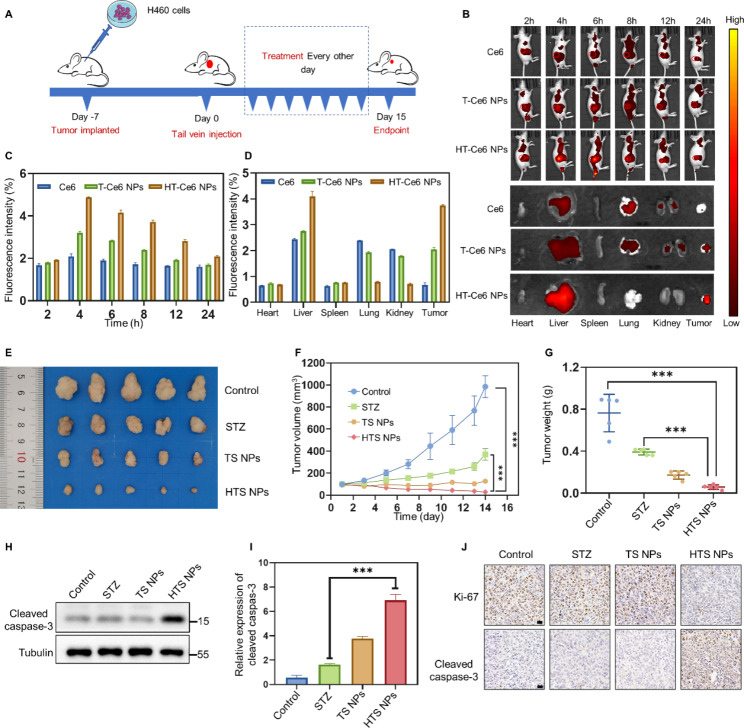
Fig. 5.
The anti-lung cancer effect of HTS NPs in vivo. (A) Schematic illustration of the establishment and treatment regime of the H460 tumor bearing BALB/c nude mice model. (B) In vivo biodistribution of Ce6, T-Ce6 NPs and HT-Ce6 NPs at indicated time points. (C-D) The fluorescence intensity was calculated and analyzed based on the data in (B). (E) Representative images of isolated tumors (n = 5). (F) Tumor volume curves of different groups (n = 5). (G) The tumor weight of the different groups (n = 5). (H-I) Western blot analysis of the cleaved-caspase 3 levels in these tumor tissues obtained from different groups at the 14th day. (J) Ki-67 and cleaved-caspase 3 immunohistochemistry images of mice treated with various treatment groups (Scale bars: 20 μm). The error bars represent the means ± SD (***P < 0.001)

