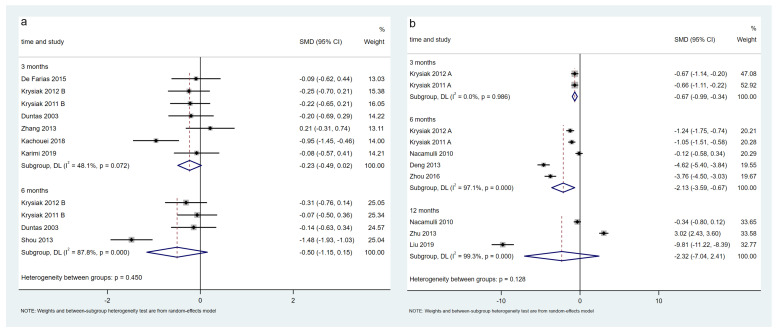
Figure 5.
Difference in Tg-Ab levels between the selenium group and control group in LT4 (a) and non-LT4 treatment groups (b). The black block represents the effect sizes of individual studies, red dashed line represents combined effect sizes, blue diamond block represents the 95%CI of combined effect sizes [24,26,27,28,32,34,35,36,38,39,40,44,45].

