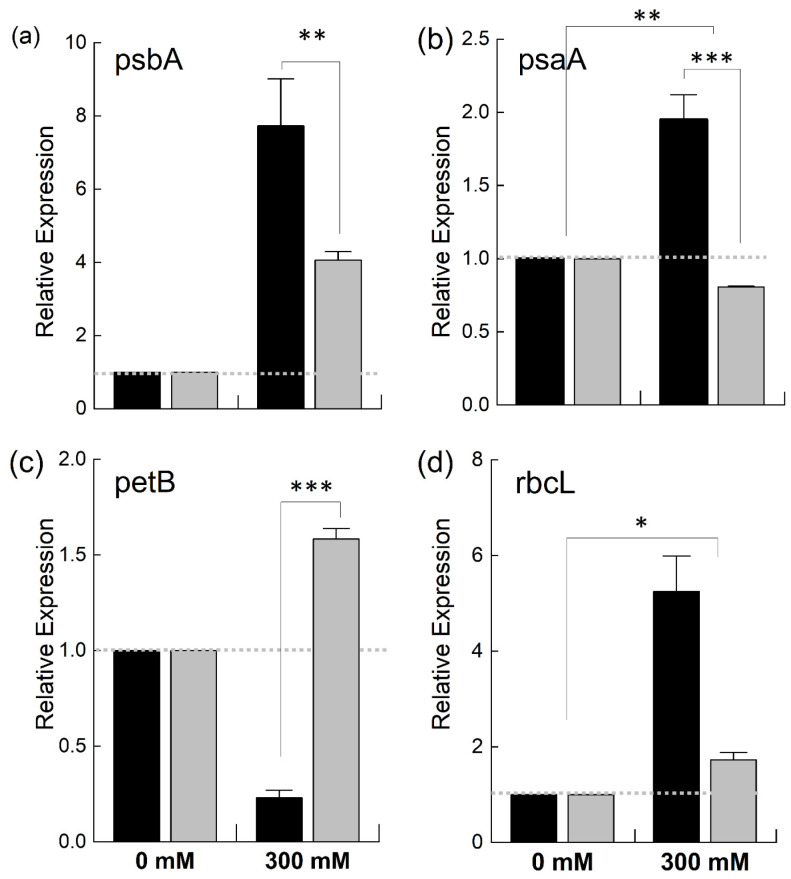
Figure 8.
Relative expression of different chloroplast genes under salt stress. Fully expanded leaves of Brassica juncea (black bars) and Brassica napus (grey bars) plants exposed to either 0 or 300 mM NaCl were used to determine the expression levels of psbA (a), psaA (b), petB (c), and rbcL (d). The dotted grey lines represent the expression level of the genes in unstressed plants. Data points are the means ± SD of three biological replicates. Statistically significant differences are shown with different asterisks (***, **, * at p = 0.001, 0.01, 0.05, respectively).

