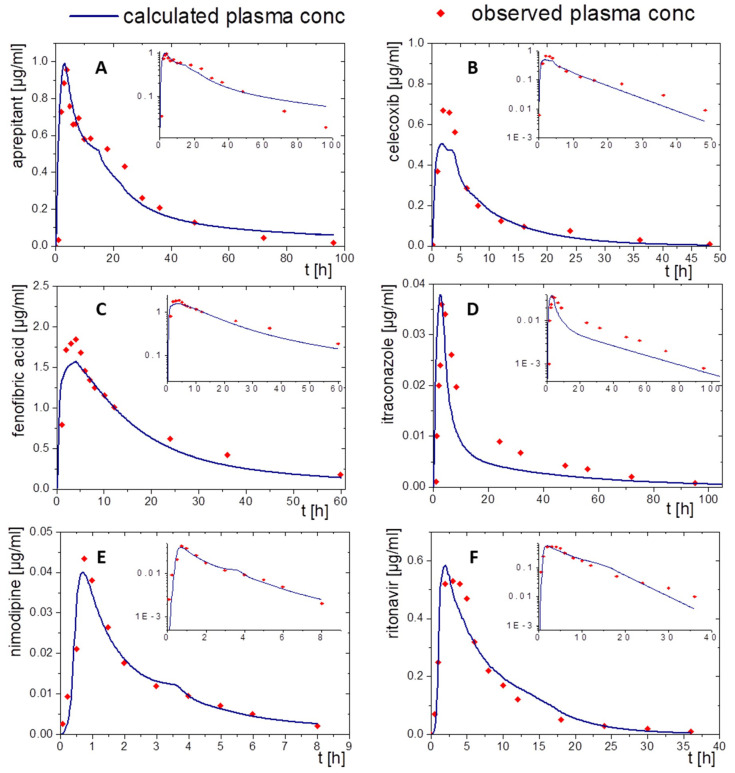
Figure 8.
Simulated plasma concentration time profile based on in vitro distribution data of the BiPHa+ dissolution test using the GastroPlus® controlled release function after oral administration (blue line) and in vivo data (red dots) for the drug products of (A) aprepitant, (B) celecoxib, (C) schfenofibrate, (D) nimodipine, (E) itraconazole, and (F) ritonavir.

