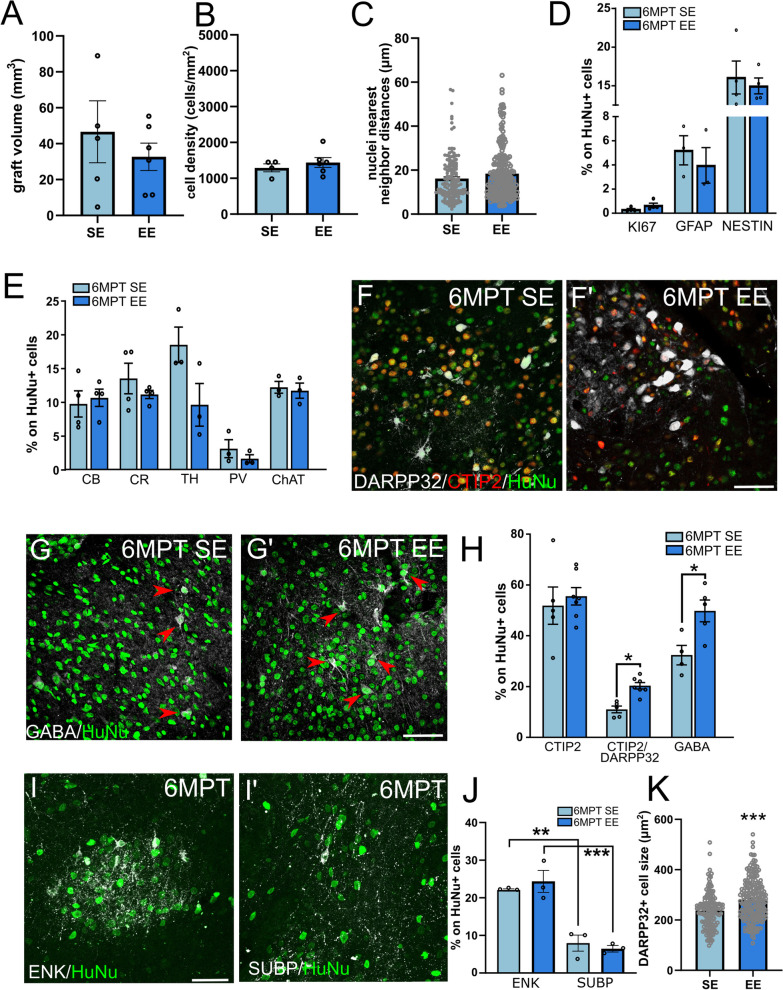
Fig. 2.
Analysis of human striatal grafts in standard and environmental enrichment housing at 6 MPT. A Similar graft volumes in SE and EE conditions (unpaired t test, p > 0.05 ns. N = 5 animals SE, 6 EE). B Similar graft cell densities in SE and EE conditions (unpaired t test, p > 0.05 ns. N = 4 animals SE, 6 EE). C Similar nearest neighbor distances of human nuclei in SE and EE groups (unpaired t test, p > 0.05 ns; N = 30 cells/animal; 5 animals SE; 6 EE). D Proportions of proliferative (KI67+; N = 4 SE; 4 EE), astroglial (GFAP+; N = 3 SE; 3 EE), or immature (NESTIN+; N = 4 SE; 4 EE) cells do not differ between SE and EE conditions (unpaired t tests, p > 0.05). E Proportions of interneuron markers expressed by grafted cells in SE and EE conditions (unpaired t tests, p > 0.05 ns; CB and CR, N = 4 SE, 4 EE; TH, PV and ChAT, N = 3 SE, 3 EE). F and F′) Representative images showing increased DARPP32 expression in CTIP2+ neurons in EE housing compared to SE. G and G′ GABA-positive (red arrows) neurons in SE and EE human grafts. H Increased expression of DARPP32 and GABA in HuNu+ neurons in EE compared to SE (CTIP2, unpaired t test, p > 0.05 ns; DARPP32 and CTIP2/DARPP32, unpaired t test, p < 0.05. N = 6 SE, 7 EE; GABA, unpaired t test, p < 0.05; N = 4 SE, 5 EE) I Enkephalin (ENK)-positivity (white) in HuNu+ graft cells (green). I′ SubstantiaP (SUBP)-positivity (white) in HuNu+ graft cells (green). J Quantification of ENK and SUBP expression in human graft cells in SE and EE groups (One-way ANOVA, Bonferroni post hoc test, 6MPT SE ENK versus 6MPT SE SUBP, p < 0.01; 6MPT EE ENK vs. 6MPT EE SUBP, p < 0.001. N = 3 SE, 3 EE). K Analysis of DARPP32-positive human MSN size (unpaired t test, p < 0.001. N = 30 cells/animal; 5 animals SE, 7 EE). Data are represented as mean ± SEM. Scale bars: 50 μm

