Fig. 3.
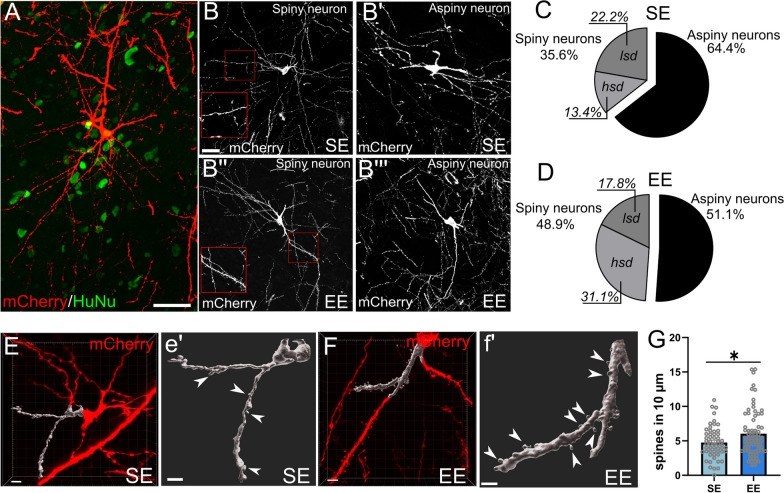
Morphological analysis of hMSNs reveals enhanced differentiation in environmental enrichment compared to standard conditions. A-B′″ Representative images of human (HuNu+) neurons expressing mCherry upon transduction with mRV showing Spiny or Aspiny features in SE (B, B′) and EE (B″, B′″). C and D Proportions of Spiny and Aspiny human neurons in SE and EE conditions. E, e′ and F, f′ 3D rendering of mCherry expressing neurons in SE or EE displaying representative examples of dendrites (gray segment) and spines (arrowheads) considered for analysis (Chi-square test Aspiny vs. Spiny SE vs. EE, p = 0.230; N = 6 cells SE, 14 EE; chi-square test hsd neurons vs. others SE vs. EE, p = 0.042. N = 45 cells SE; 45 EE). G Spine number along 10um dendrites in SE and EE groups (one-tailed Mann–Whitney test, p = 0.028. SE N = 54 dendrites; EE, N = 68 dendrites). Scale bars: 50 μm (A, B); 3 μm (E, e′, F, f′)

