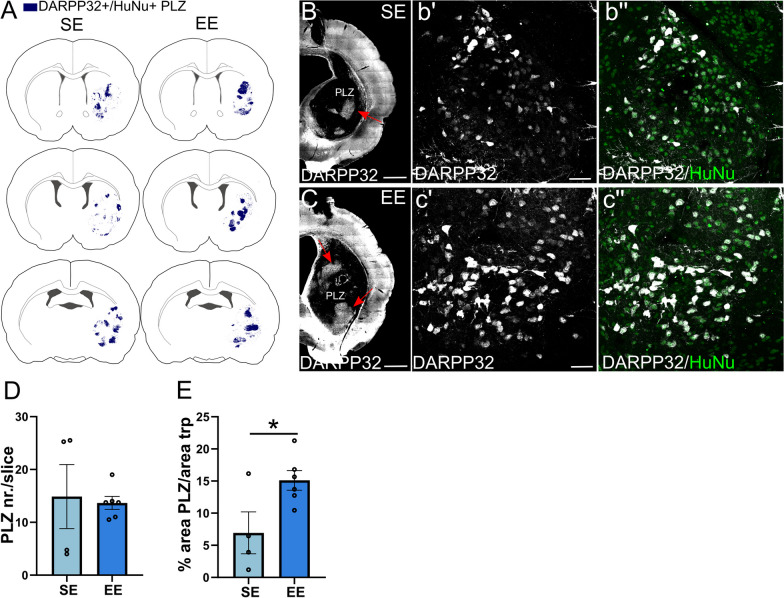
Fig. 4.
Analysis of human striatal graft compartmentalization. A Representative maps of the distribution of DARPP32+ cells in human striatal grafts. The fluorescent signal of DARPP32 staining was converted into a vector bitmap image by Inkscape software and overlapped with a schematic representation of rat brain coronal sections. B and C Representative images showing graft DARPP32+ neuron patch-like zones (PLZ; highlighted by the red arrowhead) in SE (B) and EE (C) housing. b′ and b″ High magnification confocal images illustrating clustered DARPP32-expressing HuNu+ neurons in SE grafts. c′ and c″ High magnification confocal images illustrating clustered DARPP32-expressing HuNu+ neurons in EE grafts. D Average numbers of DARPP32+ clusters per slice, in SE and EE conditions (unpaired t test, p > 0.05 ns; N = 4 SE, 6 EE). E DARPP32+ cluster size in EE compared to SE (unpaired t test, p < 0.05; N = 4 SE, 6 EE). Data are represented as mean ± SEM. Scale bars: 1 mm (B, C); 50 μm (b′–c″)

