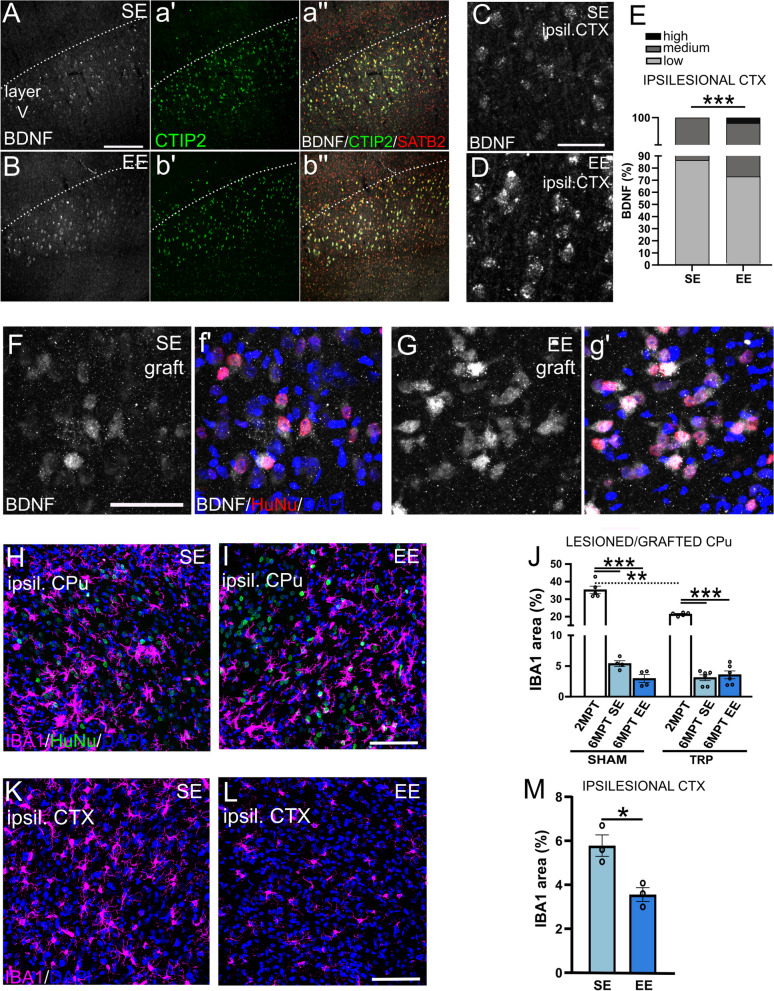
Fig. 7.
Analysis of BDNF and IBA1 expression levels in SE and EE housing conditions. A and B Expression of BDNF in the ipsilesional cortex of SE and EE housed animals, respectively. Cortical neurons are labeled with CTIP2 and SATB2 markers (a'-b''). C and D High-magnification images showing BDNF+ cortical neurons in SE and EE, respectively. E Proportions of cells with distinct BDNF staining intensities in SE and EE condition, in the ipsilesional cortex. F and G High-magnification images showing BDNF expression in human (HuNu+) cells in the graft, in SE and EE conditions. H and I Representative images showing host IBA1-positive microglia (purple) in the grafted striatum of SE and EE animals. J Quantification of IBA1 expression in the striata (referring to the coordinates in the rat brain atlas) with and without grafts (SHAM) at short and long transplantation time and in SE and EE housing (one way ANOVA SHAM, p < 0.001. One way ANOVA TRP, p < 0.001. One-way ANOVA tot, p < 0.001. N = 5 SHAM 2MPT, 4 SHAM 6MPT SE; 4 SHAM 6MPT EE; 5 TRP 2MPT; 5 TRP 6MPT SE; 6 TRP 6MPT EE). K and L Representative images showing IBA1+ microglia in the ipsilesional cortex of SE and EE conditions. M The graph shows the quantification of IBA1 signal in the ipsilesional cortex (One-way ANOVA, p < 0.05. N = 3 rats SE, 3 EE). Data are represented as mean ± SEM. Scale bars: 200 μm (A); 50 μm (C; F); 100 μm (I; L)

